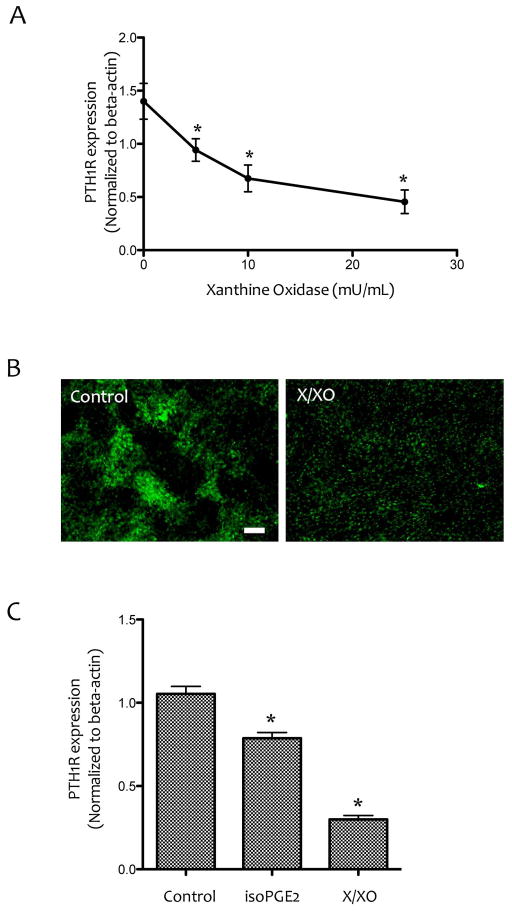
Figure 6. Effects of ROS on PTH1R expression.
(A) Realtime RT-qPCR analysis of PTH1R expression in MC3T3-E1 cells treated with xanthine (25 μM) and the indicated concentrations of xanthine oxidase. *p < 0.05 vs. control. (B) Immunofluorescence images of MC3T3-E1 cells treated with vehicle or X/XO (25 μM/25 mU/mL) using anti-PTH1R antibody. Magnification bar − 200 μm. (C) Realtime RT-qPCR analysis of PTH1R expression in MC3T3-E1 cells treated with vehicle, isoPGE2 (25 μM) or X/XO (25 μM/25 mU/mL). *p < 0.05 vs. vehicle control.

