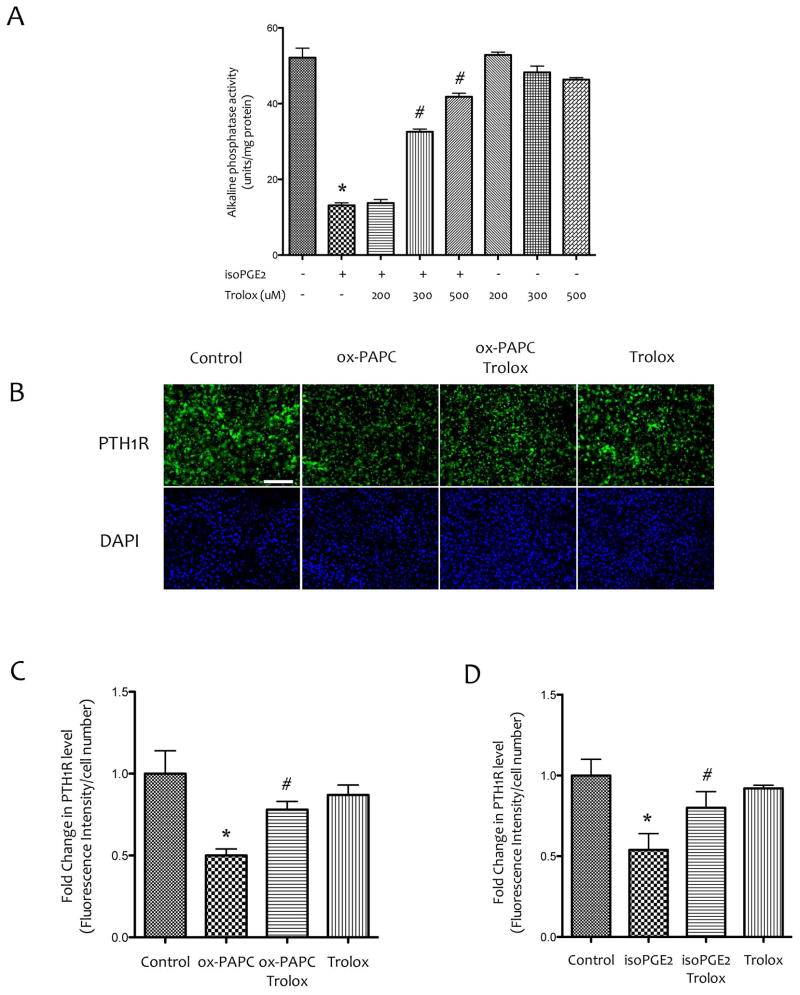
Figure 8. Effects of antioxidants on the inhibitory effects of bioactive inflammatory lipids.
(A) Alkaline phosphatase activity of MC3T3-E1 cells that were pretreated with vehicle or Trolox at the indicated concentrations for 1 hr followed by co-treatment with Trolox and isoPGE2 for 6 days. (B) Immunofluorescence images of MC3T3-E1 cells that were pretreated with vehicle or Trolox (400 μM) for 1 hr, followed by co-treatment with vehicle, ox-PAPC (10 μg/ml) and/or Trolox for 6 days. Magnification bar − 200 μm. (C) Quantitative analysis of PTH1R immunofluorescence shown in (B). (D) The levels of PTH1R in MC3T3-E1 cells that were pretreated with vehicle or Trolox (400 μM) for 1 hr, followed by cotreatment with vehicle, isoPGE2 (30 μM) and/or Trolox for 6 days. Fluorescence images were quantified using Metamorph image analysis. *p < 0.05 vs. vehicle, #p < 0.05 vs. isoPGE2 or ox-PAPC.

