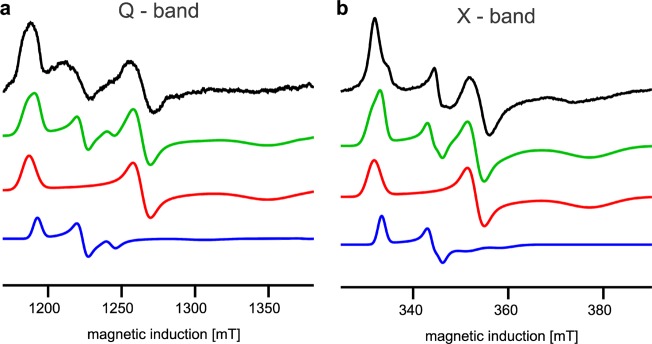
Figure 3.

Simulating EPR spectra to define the physical nature of the g = 1.94 transition. Analysis of EPR transitions in a magnetic field range of the FeS signal at Q-band (a) and X-band (b) for the antimycin-inhibited +2Ala mutant. In panels a and b, experimental spectra (black) were simulated (green) as a sum of the FeS spectra (red) and the spectra resulting from exchange coupling between FeS and SQo (blue), assuming |J0| ∼ 3500 MHz. Blue and red represent 17 and 83%, respectively, of the total number of spins in green. The blue spectrum in panel b represents the spectrum of the SQo–FeS triplet state.
