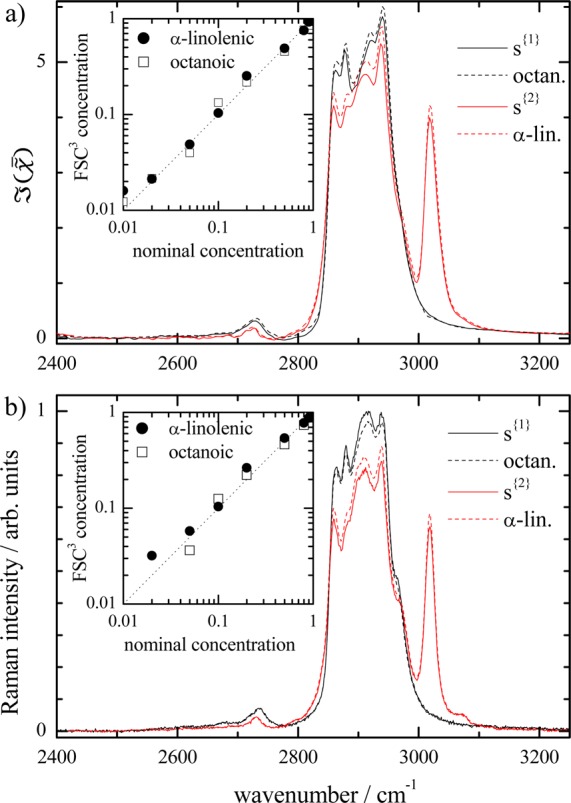
Figure 2.

a) FSC3 spectra s{k} (solid lines) of mixtures of octanoic
and α-linolenic
acid, compared with the spectra of the pure compounds (dashed lines).
Inset: FSC3 concentrations (v/v) c{k} versus nominal concentration. (b) as (a)
for Raman spectra.
