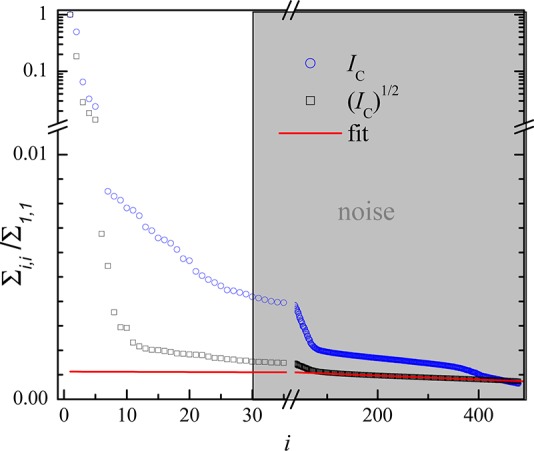
Figure 3.

Singular values of the SVD noise-filtering procedure. Squares and circles show singular values of (IC)1/2 and IC, respectively, and the red line is a linear fit to the singular values of (IC)1/2 for i > 240. The gray area indicates the values set to zero for noise filtering.
