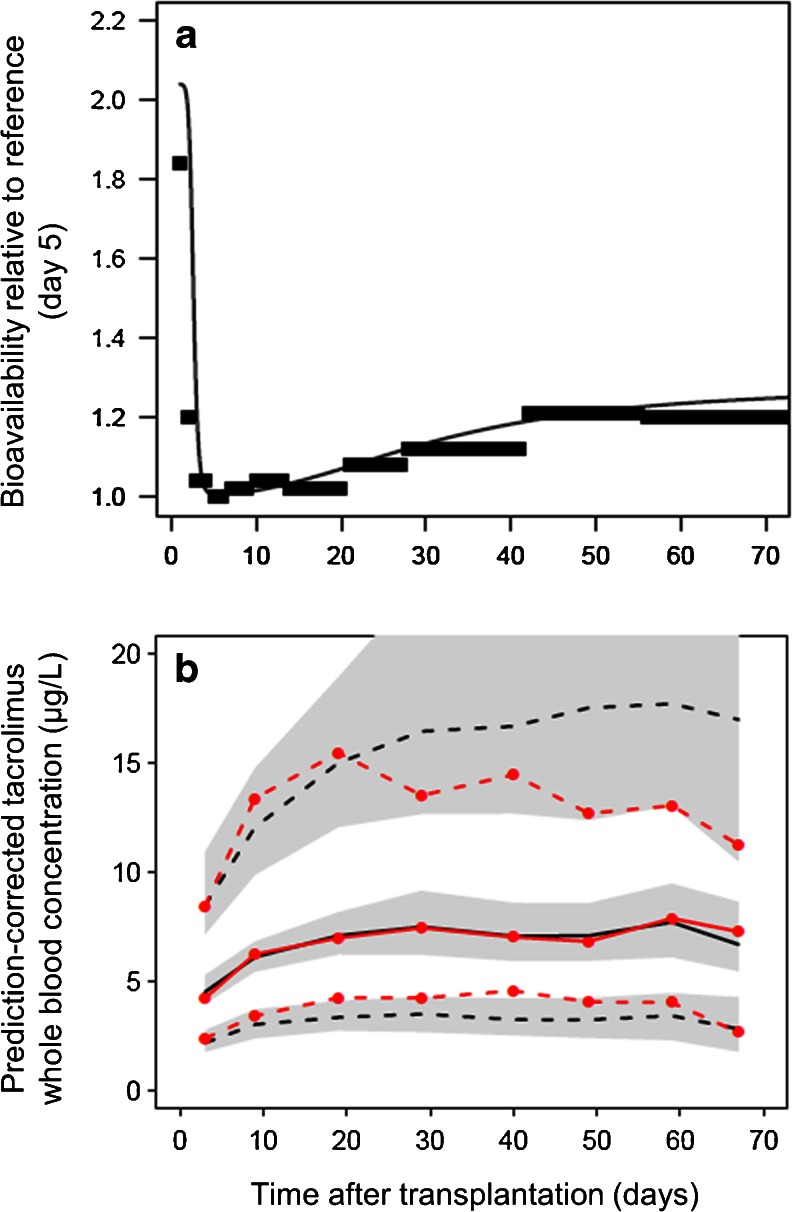
Fig. 4.
a Thick horizontal lines Time interval-specific average values of bioavailability after transplantation, estimated relative to the value at day 5 (defined as F = 1). Thin continuous line Model-estimated time course of relative bioavailability during the first 70 days after transplantation. b pcVPC using the final model as a function of the first 70 days after transplantation. Solid red line Median observed tacrolimus concentration (prediction-corrected), dashed red lines 90 % observation interval (5th to 95th percentile), solid black line median model predicted concentrations, dashed black lines 90 % prediction interval. Gray-shaded areas 95 % CI for each model-predicted percentile

