
Fig 5.
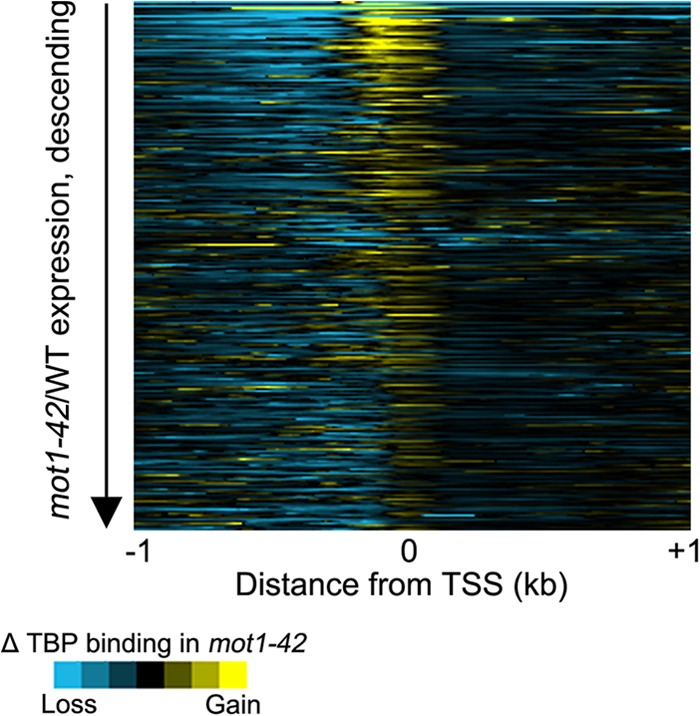
Loss of Mot1 results in correlated changes in gene expression and TBP binding. Heat map of the change in TBP binding between the mot1-42 strain and control (wild type [WT]) strain (10′ MNase) around TSSs. The heat map is shown in descending order by the change in expression of the associated gene in the mot1-42 strain.