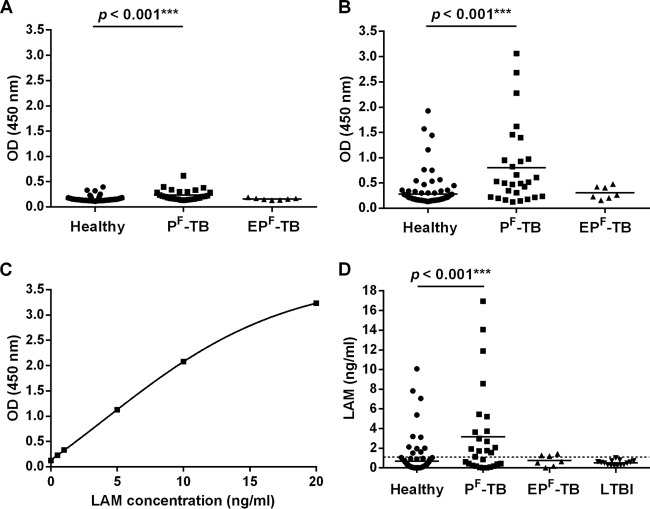
Fig 1.
Analysis of urine samples from patient groups and healthy volunteers. ODs of nonconcentrated (A) and concentrated (B) samples from healthy (n = 101), PF-TB (n = 28), and EPF-TB (n = 7) groups. (C) Calibration curve of uLAM samples (range, 0 to 20 ng/ml, nonconcentrated). (D) uLAM concentrations estimated from the calibration curve. Healthy (n = 101), PF-TB (n = 28), EPF-TB (n = 7), and LTBI (n = 15) groups. Horizontal bars show the mean concentrations. The cutoff (1.1 ng/ml) is presented with a dashed line.

