
Fig 2.
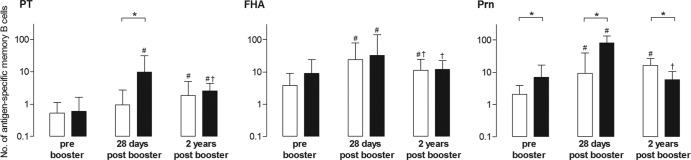
Numbers of memory B cells specific for PT, FHA, and Prn per 105 B cells in wP-primed children (white bars) and aP-primed children (black bars) prebooster and 28 days and 2 years after booster vaccination (n = 11 to 19 per group). Bars indicate geometric mean values with 95% CIs. ∗, significantly different numbers in aP-primed children compared to wP-primed children, P < 0.05; #, significantly increased numbers postbooster compared to prebooster, P < 0.05; †, significantly decreased numbers 2 years postbooster compared to 28 days postbooster, P < 0.05.