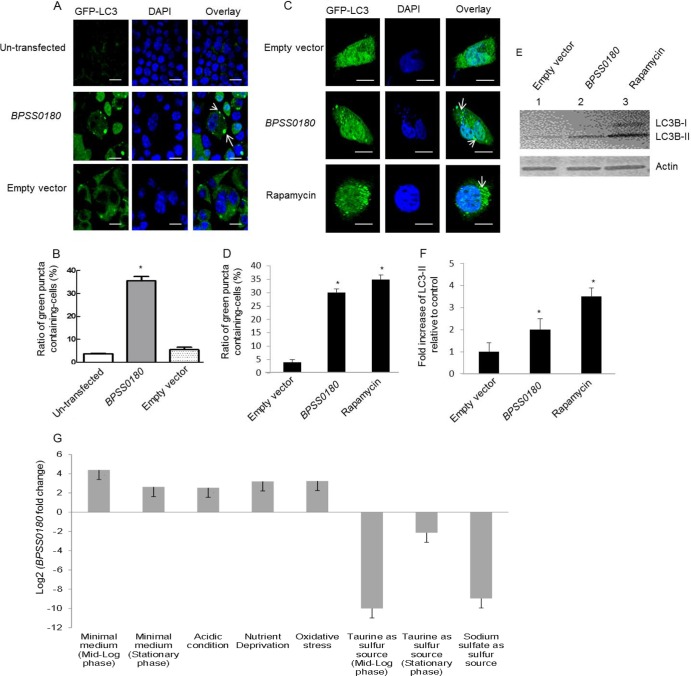
Fig 5.
Plasmid-independent induction of autophagy by BPSS0180 in phagocytic and nonphagocytic cells and BPSS0180 transcriptional regulation. (A) Representative confocal images of RAW264.7 (phagocytic) cells stably expressing GFP-LC3 and transfected with empty vector (pCI-neo) or a construct encoding the BPSS0180 protein or left untransfected. Cells were fixed, permeabilized, and stained for nuclei (blue). Arrows indicate cells with GFP-LC3-labeled puncta. Bars, 10 μm. (B) Quantitative analysis of cells with GFP-LC3-labeled puncta. (C) Representative confocal images of HeLa (nonphagocytic) cells transiently expressing GFP-LC3 and transfected with empty vector (pcDNA 3.1/V5-His-TOPO) or His-tagged BPSS0180 or treated with rapamycin. Cells were fixed, permeabilized, and stained for nuclei (blue). Arrows indicate cells with GFP-LC3-labeled puncta. Bars, 10 μm. (D) Quantitative analysis of cells with GFP-LC3-labeled puncta. Asterisks indicate P values of <0.05 relative to cells transfected with empty vector or without transfection. (E) Western blots. (Top) LC3 expression of HeLa cells transfected with empty vector or BPSS0180 or treated with rapamycin. (Bottom) Actin as a loading control. (F) Fold increases in LC3-II were determined by densitometric quantitative comparison of each LC3-II band to the same band in the cells transfected with empty vector (lane 1 in panel E). Each band was normalized against the actin control band. Asterisks indicate P values of <0.05 relative to cells transfected with empty vector. (G) Graph depicting BPSS0180 expression across various perturbations (listed below the graph). See Table S2 in the supplemental material for details of experimental and reference conditions. All BPSS0180 expression alterations represent differential regulation, as indicated by a change of ≥2-fold (absolute log2 BPSS0180 fold change of >1) and pass the threshold level of statistical significance (P < 0.001).

