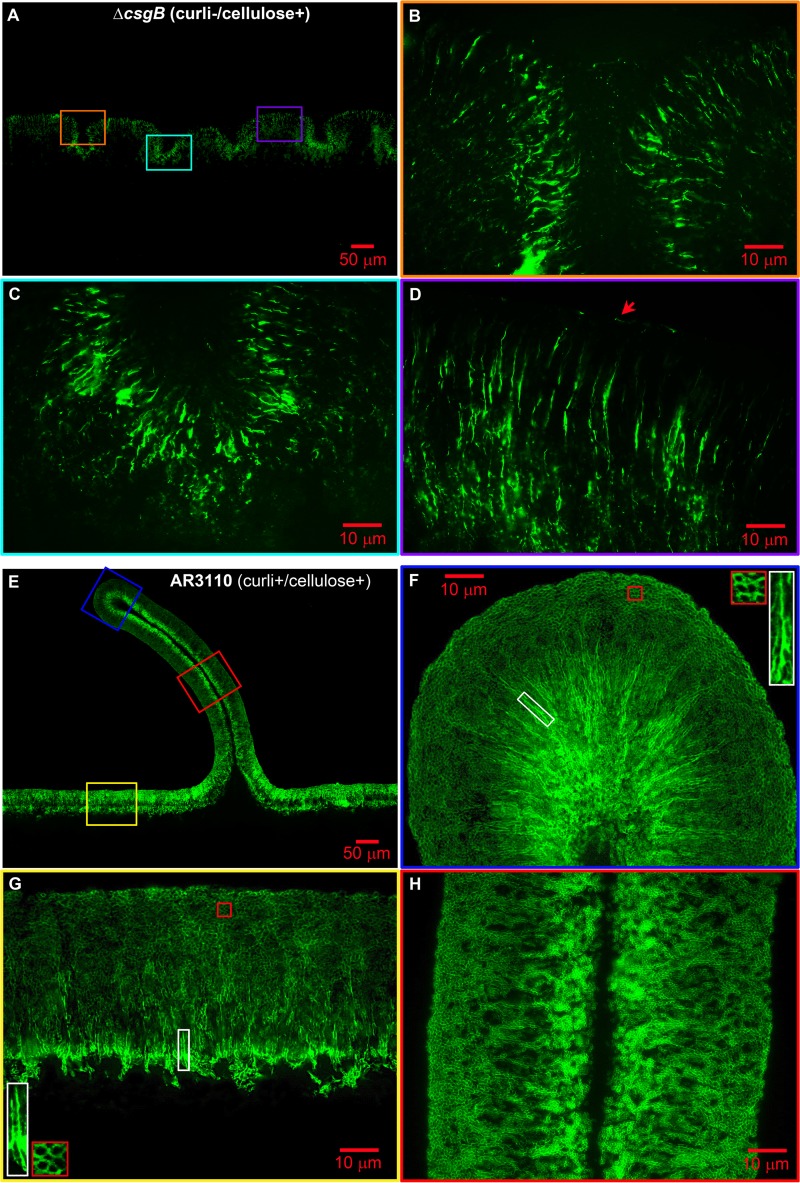
Fig 5.
Cellulose and curli exhibit differential distribution and specific spatial arrangement in E. coli macrocolonies. (A) Low-magnification image showing TS fluorescence in a representative AR3110 csgB macrocolony cross-section, as presented in Fig. 4D. (B to D) Enlarged views of TS fluorescence pattern in respective color-coded macrocolony areas boxed in A. The arrow in D points to a cellulose string lying on the surface. (E) Low-magnification image showing TS fluorescence in a representative AR3110 macrocolony cross-section, as presented in Fig. 4B. (F to H) Enlarged views of TS fluorescence pattern in respective color-coded macrocolony areas boxed in panel E. The insets in panels F and G show enlarged views of the respective color boxed areas.

