
Fig 7.
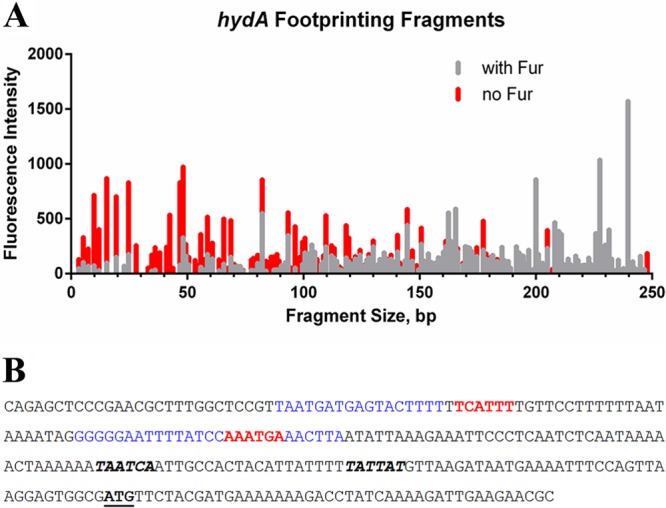
DNase I footprinting of the hydA promoter. A fragment of the hydA promoter fluorescently labeled at the 5′ end was subjected to DNase I digestion in the absence and presence of apo-Fur (A). Protected regions are those with reduced peak height and/or entirely missing peaks in the presence of apo-Fur (gray lines) compared to digestion fragments in the absence of Fur (red lines). (B) Sequence of the hydA promoter fragment utilized in the footprinting experiments. The conserved apo-Fur box sequences are in red, and the protected regions as identified through DNase I footprinting are in blue. The −10 and −35 promoter elements are shown in bold italics; the ATG start codon is in bold and underlined.