Fig 2.
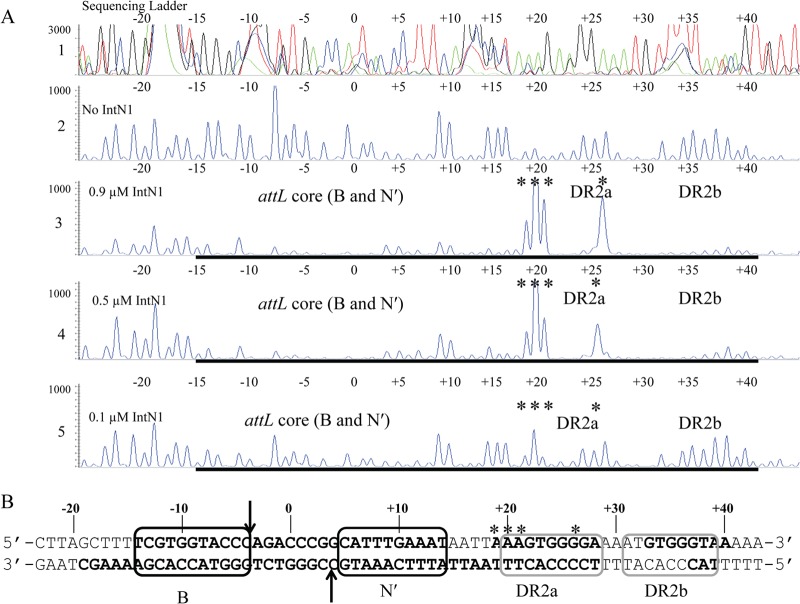
(A) DNase I footprint of IntN1 on the top strand of attL. Panel 1 shows a sequencing ladder generated using dideoxy sequencing reactions with the same 6-FAM-labeled primer used to make the footprinting substrate; green denotes adenine, blue denotes cytosine, black denotes guanine, and red denotes thymine. Panel 2 shows a DNase I digestion of top-strand-labeled attL in the absence of IntN1. Panels 3 through 5 show footprinting reactions with decreasing concentrations of IntN1. If IntN1 is diluted to 0.015 μM, a footprint is no longer detected (data not shown). The concentrations of IntN1 are indicated on the left sides of panels 3 through 5. Regions of protection from DNase I cleavage are denoted with bold black lines, and locations of enhanced cleavage are marked by asterisks. (B) IntN1 protection corresponding to the core-type sites and two arm-type sites on attL. Bolded bases denote regions protected from cleavage by DNase I in the presence of IntN1. Asterisks denote regions of enhanced DNase I cleavage in the presence of IntN1. Black boxes denote core-type sites B and N′, and gray boxes denote arm-type sites DR2a and DR2b. The arrows denote the sites of IntN1 cleavage during recombination. The overlap region is located between the N′ and B core-type sites, and the middle base of the overlap region is denoted by “0.”

