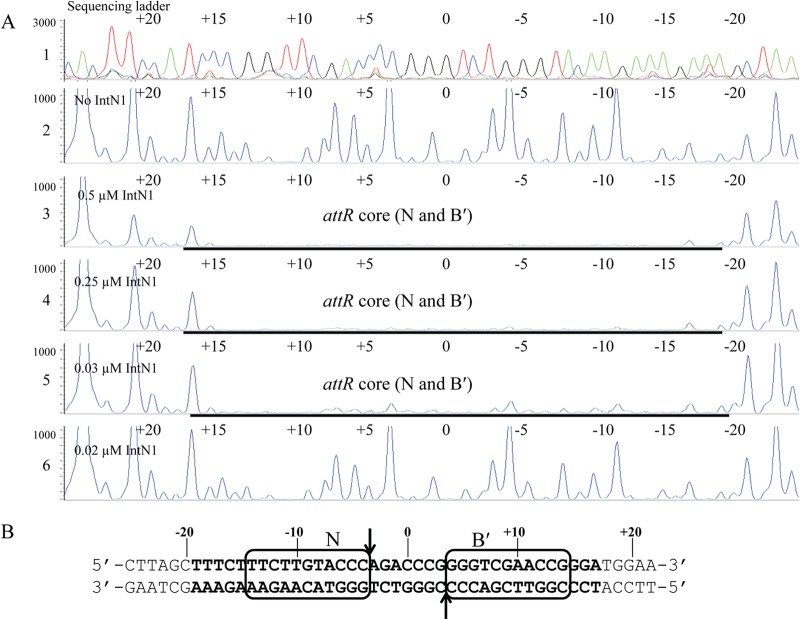
Fig 3.
(A) IntN1 protection around the core of the bottom strand of attR. Panel 1 shows a sequencing ladder generated by dideoxy sequencing reactions. Green denotes adenine, blue denotes cytosine, black denotes guanine, and red denotes thymine. Panel 2 shows a DNase I footprinting reaction in the absence of IntN1. Panels 3 through 6 show footprinting reactions with decreasing dilutions of IntN1. IntN1 concentrations are shown at the left of panels 3 through 6. (B) IntN1 protection around the attR core. Bolded bases were protected from DNase I cleavage by IntN1. The black boxes denote core-type sites N and B′. The arrows indicate the cleavage sites.

