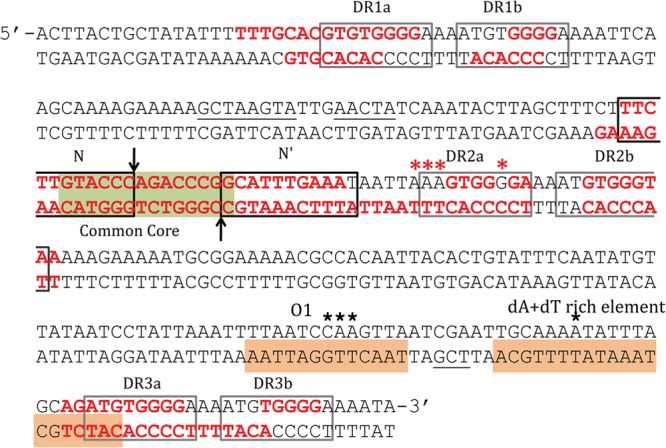
Fig 7.

IntN1 and Orf2x protection on attN1 as determined by DNase I footprinting analysis. The black boxes indicate IntN1 core-type sites, and the gray boxes denote arm-type sites. The green box represents the common core region, and the vertical arrows indicate the sites of cleavage. IntN1 protection is shown by red bases, and enhancement of DNase I cleavage in the presence of IntN1 is shown by red asterisks. Orf2x protection is denoted by orange boxes, and black stars denote enhanced DNase I cleavage in the presence of Orf2x. Underlined bases represent bases protected from DNase I cleavage by IntN1 on only one strand.
