
Figure 2:
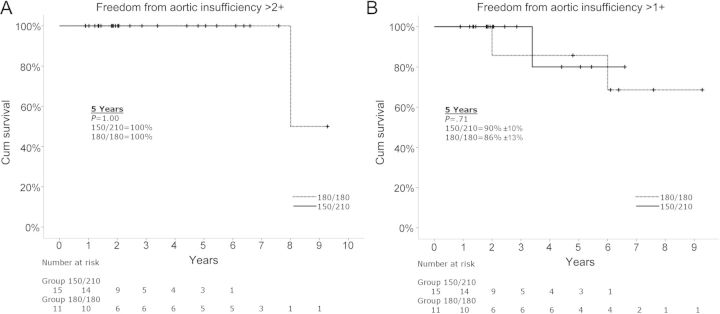
Kaplan–Meier actuarial survival curves comparing the 150°/210° orientation group to the 180°/180° orientation group. (A) Freedom from aortic insufficiency >2+. (B) Freedom from aortic insufficiency >1+.
Official websites use .gov
A
.gov website belongs to an official
government organization in the United States.
Secure .gov websites use HTTPS
A lock (
) or https:// means you've safely
connected to the .gov website. Share sensitive
information only on official, secure websites.
Kaplan–Meier actuarial survival curves comparing the 150°/210° orientation group to the 180°/180° orientation group. (A) Freedom from aortic insufficiency >2+. (B) Freedom from aortic insufficiency >1+.