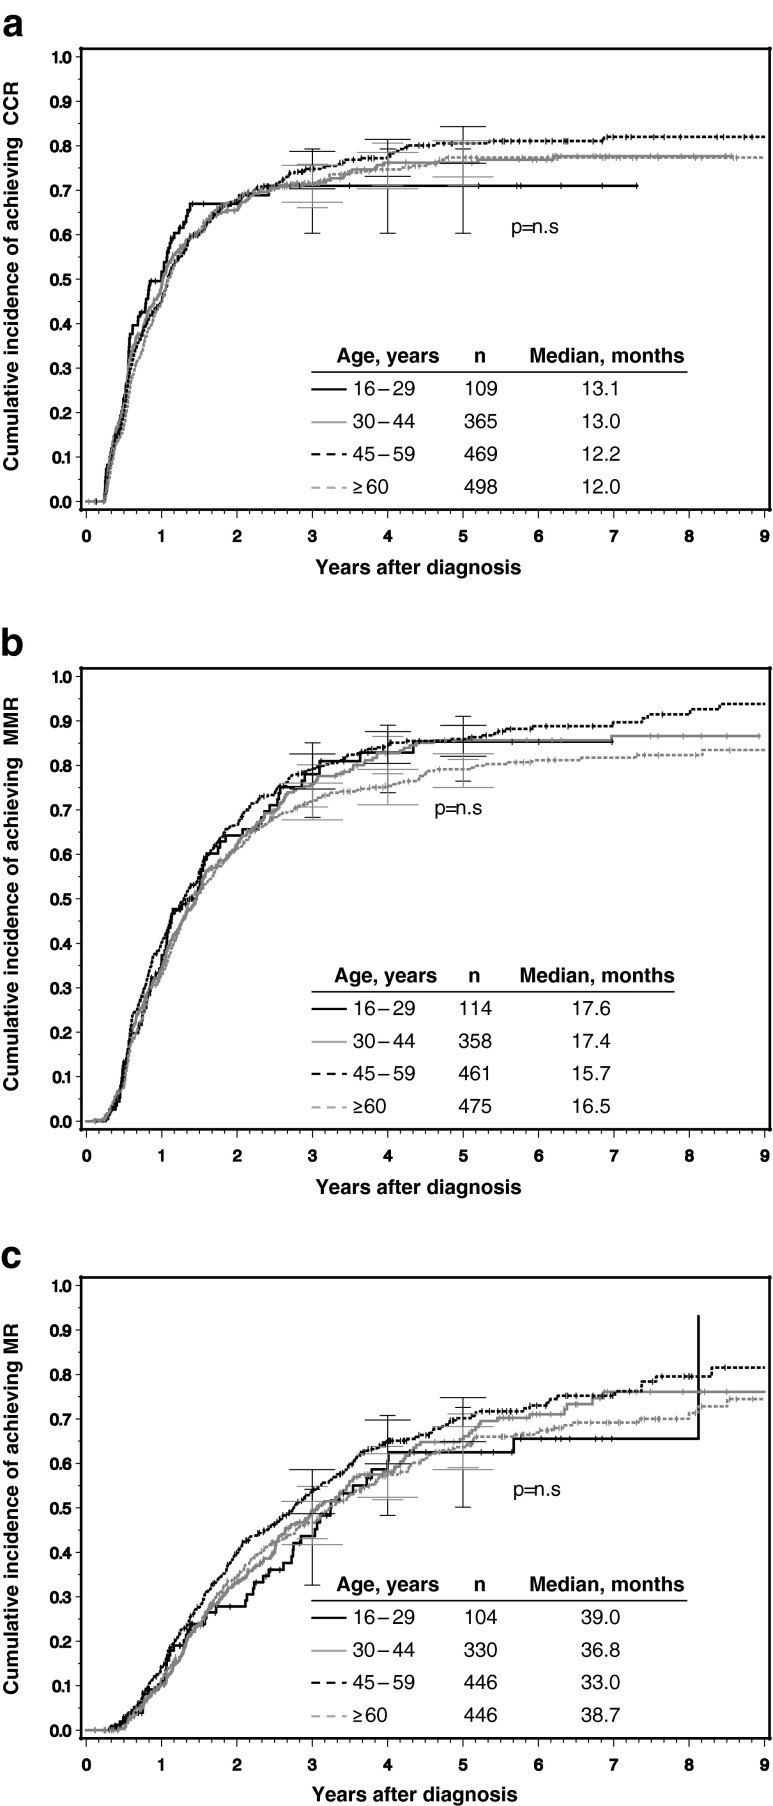
Fig. 2.
a–c Cumulative incidences of a CCR, b MMR, and c MR4 according to the four age groups determined under consideration of competing risks. n Number of patients, CCR complete cytogenetic, remission, MMR major molecular remission, MR 4 molecular remission ≤0.01 % on the international scale. p refers to level of significance between AYAs and the other three age groups

