Fig. 5.
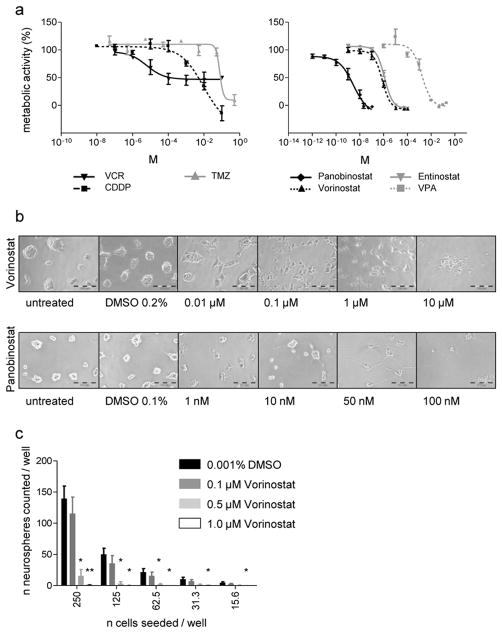
DKFZ-EP1NS cells are relatively resistant to chemotherapeutic agents, but susceptible to treatment with HDAC inhibitors (HDACis)
a Measurement of metabolic activity by WST-1 assay after treatment with chemotherapeutics vincristine (VCR), cisplatin (CDDP) and temozolomide (TMZ) (left panel), and after treatment with HDACi Panobinostat, Vorinostat (syn.: SAHA), Entinostat (syn.: MS275) and valproic acid (VPA) (right panel). Note the relative resistance to VCR, CDDP and TMZ (find EC50 and peak plasma concentrations, PPC, in Suppl. Table 4). b Brightfield images of DKFZ-EP1NS treated with Vorinostat or Panobinostat at indicated concentrations: note the reduction in neurosphere-formation and induction of a differentiated phenotype at concentrations from 0.1–1 μM Vorinostat or 10–100 nM Panobinostat, and loss of morphology possibly due to cell death above 1 μM Vorinostat or 50 nM Panobinostat. c Neurosphere initiation capacity (NSIC) assay: NSIC is strongly reduced after 10 days of treatment with Vorinostat at indicated concentrations or DMSO control. Bars represent means of three independent measurements, error bars represent SEM; * = p-value < 0.05; ** = p-value < 0.01 (treated vs. control, two-sided t-test).

