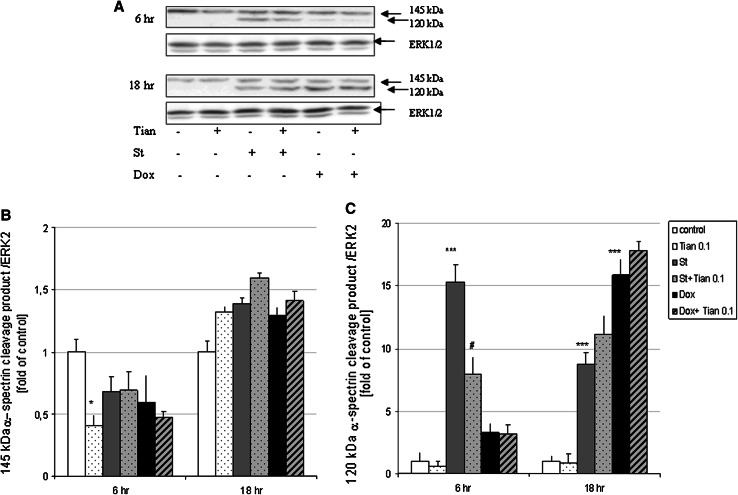
Fig. 5.
a Western blot analysis of spectrin α II cleavage products 145 and 120 kDa induced by calpains and caspase-3, respectively. Cortical neurons were treated with tianeptine (Tian 0.1 μM) and staurosporine (St, 0.5 μM) or doxorubicin (Dox, 0.5 μM) for 6 and 18 h. 145 and 120 kDa spectrin α II cleavage products and ERK2 protein levels were measured in whole cell lysates. b and c Histograms showing the quantification of Western blots using MultiGauge v.3 Software. The band intensity of spectrin α II cleavage products (145 and 120 kDa) was normalized to ERK2 level (protein load control) and calculated as fold change of control for each blot. Data from duplicate determinations in three independent experiments were shown as the mean ± SEM *p < 0.05 and ***p < 0.001 versus vehicle-treated cells; # p < 0.05 versus St-treated cells

