
Fig 5.
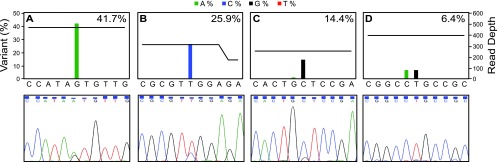
Comparison of next-generation and Sanger sequencing for detecting drug resistance mutations present as minor variants. Sequencing flowgrams (upper panels) and Sanger sequencing electropherograms (lower panels) are shown for four resistance mutations detected in the clinical plasma specimens: T503I in UL54 (A), L595S in UL97 (B), C603W in UL97 (C), and L595S in UL97 (D). The percent variant calls from the amplicon variant analyzer are indicated on the right of each flowgram. The horizontal black line on each flowgram represents the total number of reads covering each mutation and the 5 nucleotides 3′ and 5′ of the mutation.