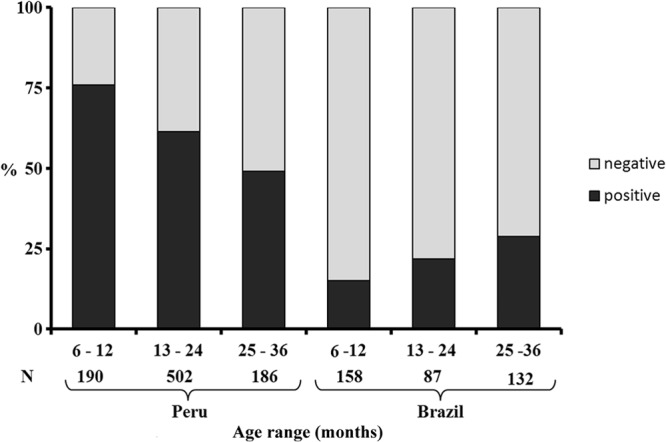
Fig 1.

H. pylori prevalences based on concomitant positive results of [13C]UBT and the monoclonal stool antigen test according to age range in Peru (P < 0.001) and Brazil (P = 0.001). The numbers at the bottom refer to the number of samples tested in each age group (total number = 1,255). Statistical analysis was done using the chi-square test.
