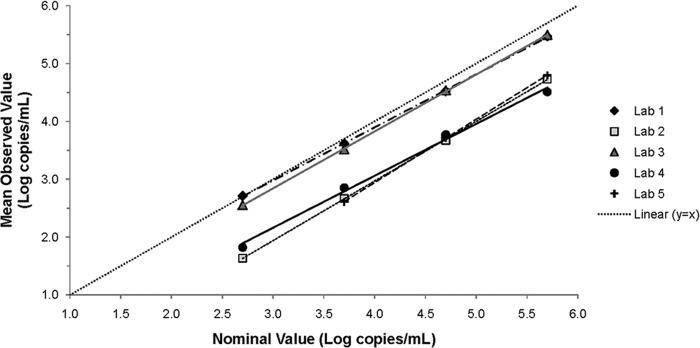
Fig 1.

Quantitative comparison of CMV panel results among five laboratories. The mean of the observed log10 concentrations for each level of the CMV panel (n = 9 from four runs) in each laboratory was plotted against the nominal log10 concentrations along with the regression line. The line of identity (y = x) is shown as a dotted line. The 2.7-log10-copy/ml panel member was excluded from the lab 5 data set because it was not reliably detected.
