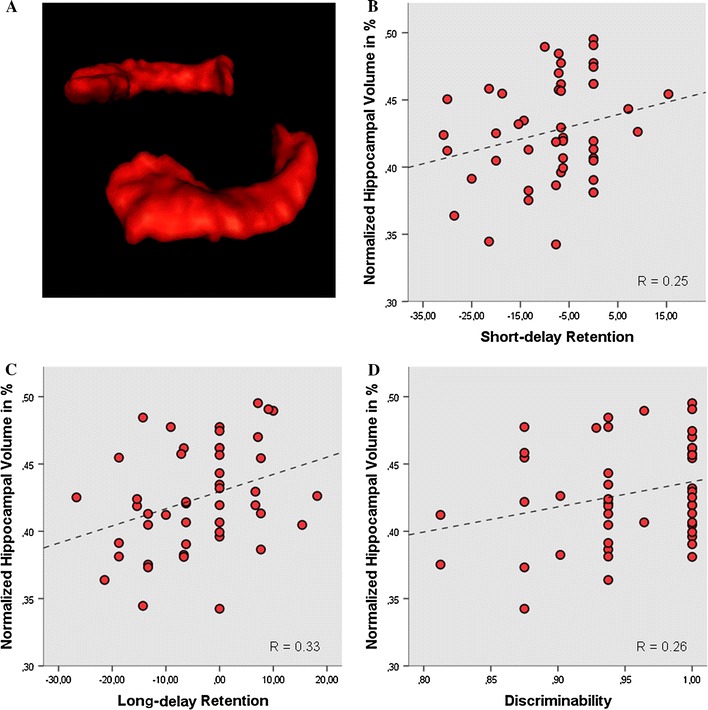
Fig. 2.

Three-dimensional rendering of the left and the right hippocampus (a). Scatterplots, including lines of best fit, showing the relationship between the normalized hippocampal volume in % and b short-delay retention, c long-delay retention, and d discriminability performance
