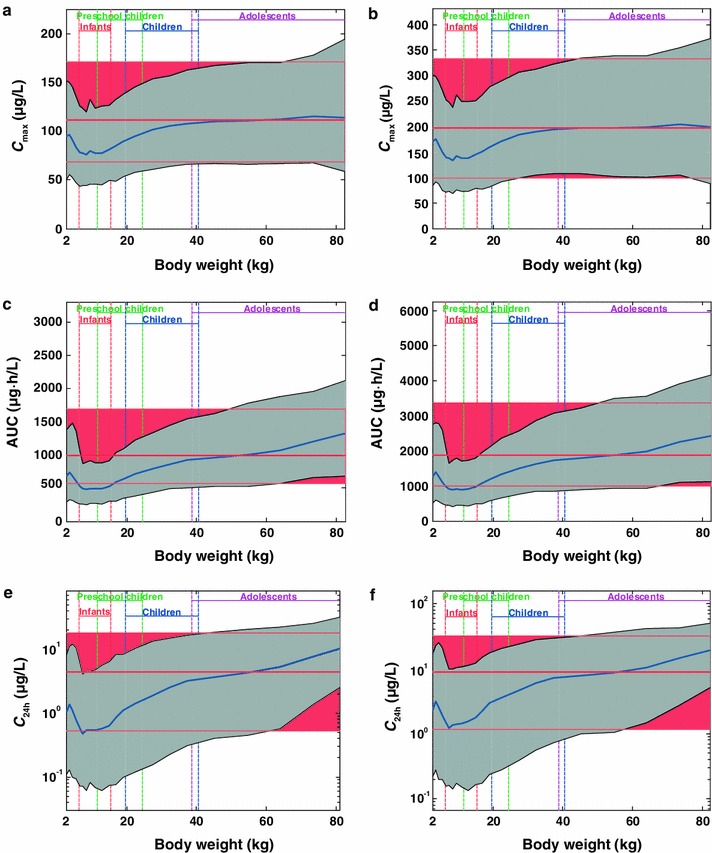
Fig. 4.

Gender-pooled paediatric simulations for maximum (peak) plasma drug concentration (C max) (a, b), area under the plasma concentration–time curve (AUC) (c, d) and concentration in plasma after 24 h (C 24h) (e, f) versus body weight for two different doses of rivaroxaban: 0.143 mg/kg body weight (a, c, e) and 0.286 mg/kg body weight (b, d, f), simulated as oral suspension formulation compared with the adult reference population. Simulated data of the paediatric population are represented as geometric means (blue line) and 90 % prediction interval (grey shaded area). Simulated data of the adult reference population are represented as geometric means (thick red line) and 90 % confidence interval (red shaded area in the background of the graph). Expected body weight ranges for infants, preschool children, children and adolescents are indicated
