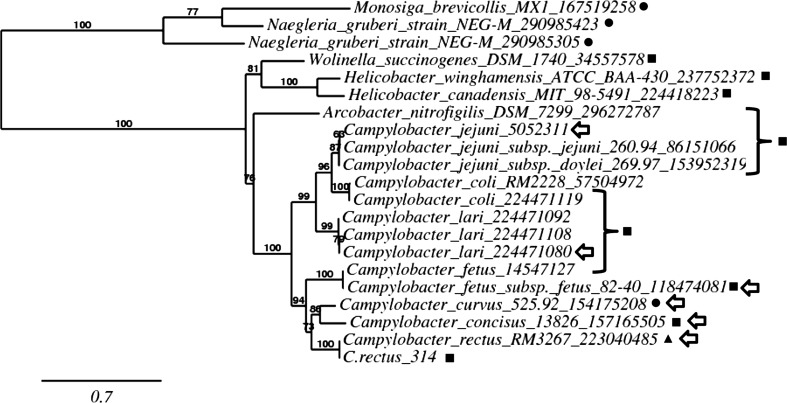
Fig. 5.
Phylogram of C. rectus strain 314 CiaB and related genes. Values at nodes represent branch support [35]. The NCBI gene identifier is indicated for each species. Proteins marked by a square are annotated as CiaB. Proteins marked with a circle are annotated as hypothetical proteins. The protein marked by a triangle is annotated as a lipoprotein signal peptidase. Proteins marked with an arrow are those presented in Table 3. The scale bar represents evolutionary distance (0.7)

