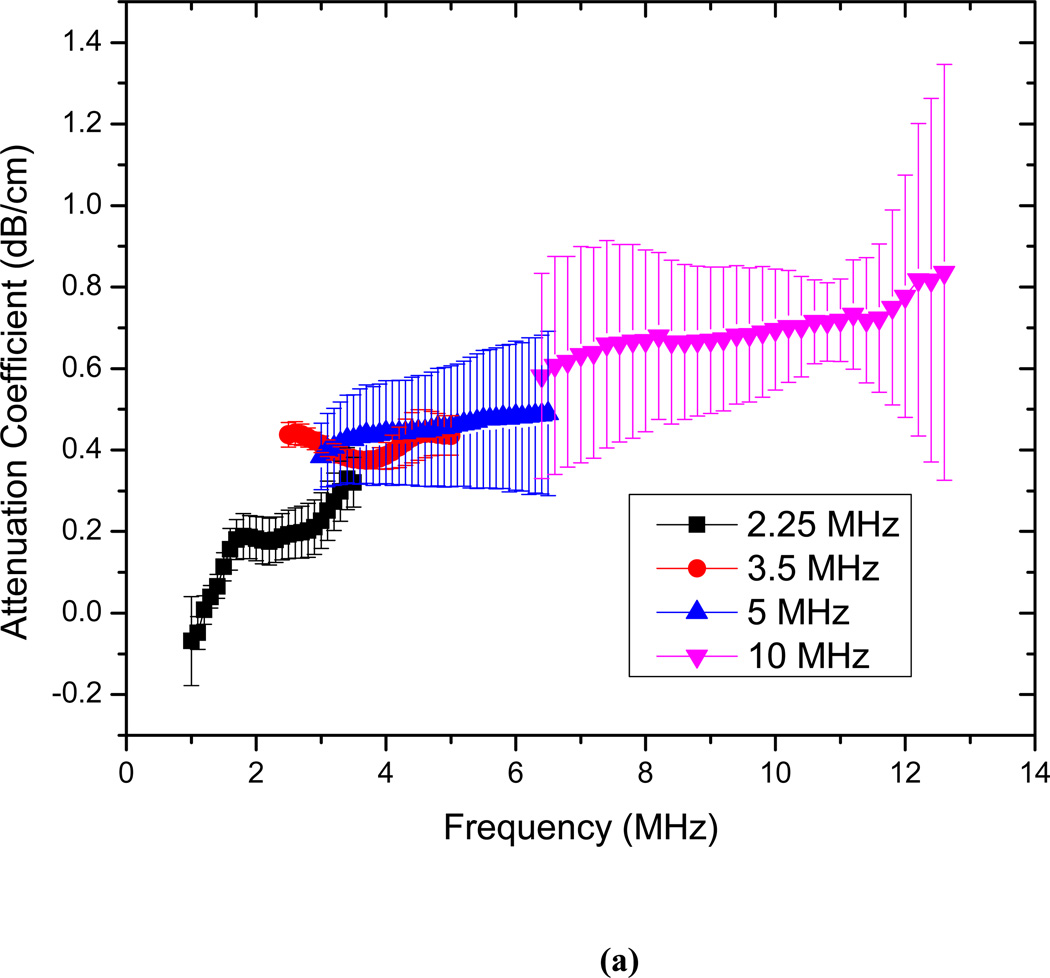
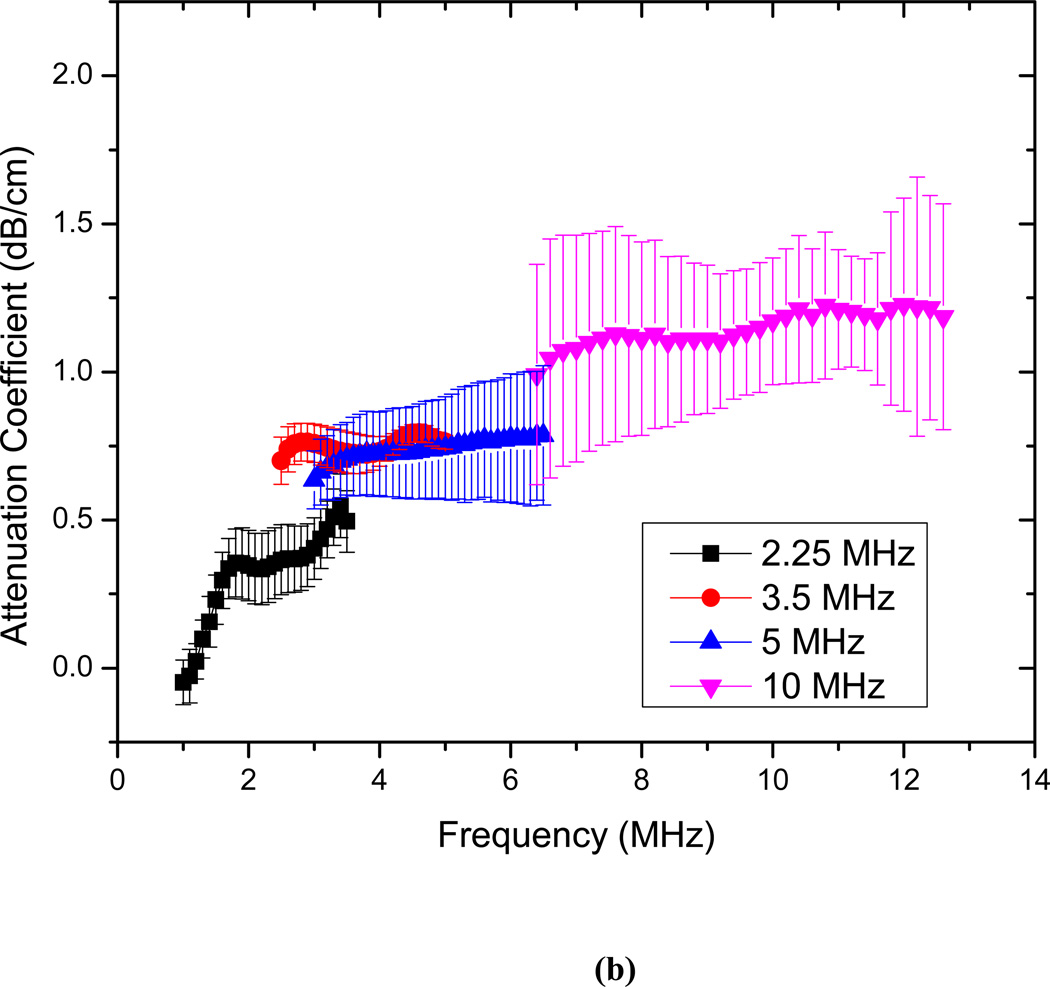
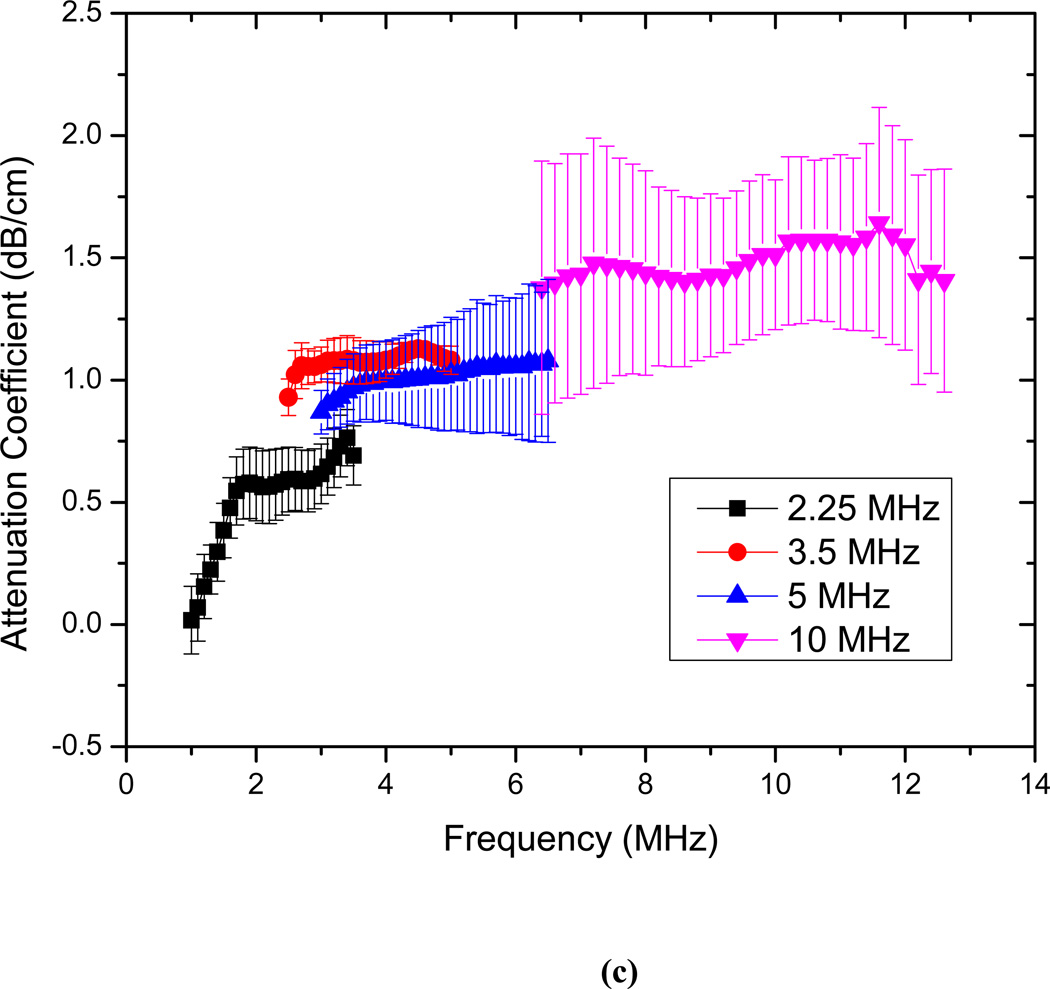
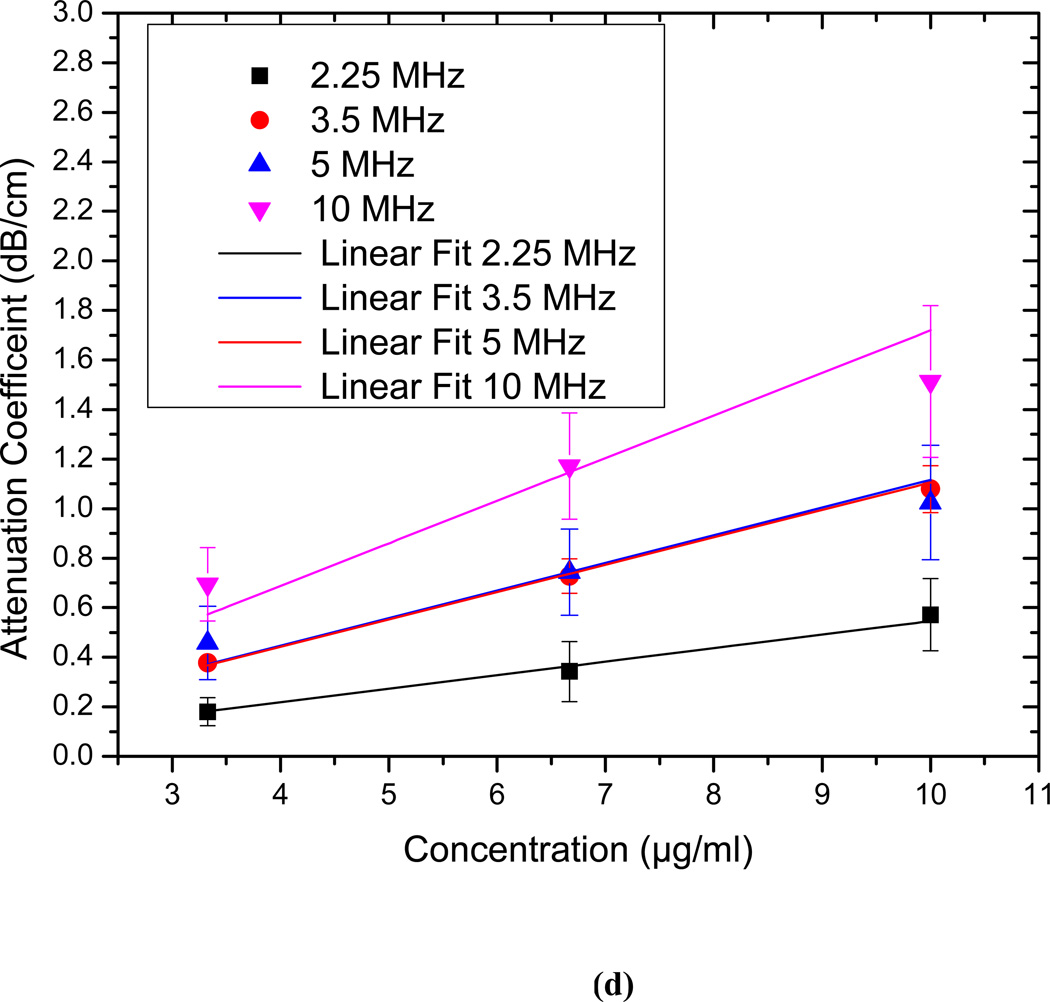
Figure 3.
Frequency dependent attenuation coefficient of echogenic liposomes measured with four different transducers (2.25, 3.5, 5, 10 MHz) and plotted within their respective −6 dB bandwidth for lipid concentrations of (a) 3.33µg/ml (b) 6.67 µg/ml and (c) 10µg/ml. Data averaged for 5 different samples, (d) Attenuation coefficient at the central frequencies of the four transducers as a function of lipid concentration.


