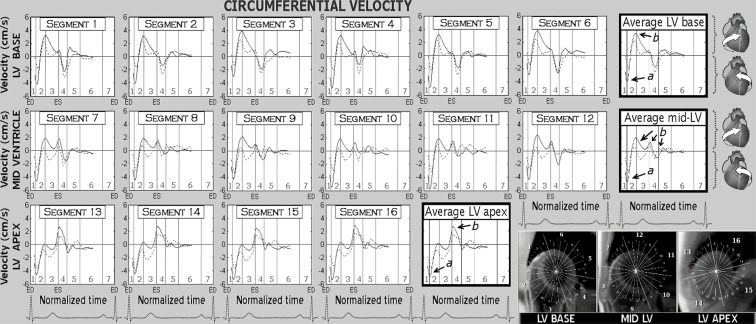
Fig. 3.
Circumferential velocity graphs for individual left ventricular segments during a cardiac cycle. The graphs represent average myocardial velocities for the two groups of volunteers (solid line, younger age group; dotted line, older age group). Positive values correspond to clockwise rotation of the left ventricle as viewed from the apex, while negative values reflect counter-clockwise motion. Average velocities for basal, mid and apical slices are shown in bold outline. The right lower montage displays left ventricular short axis images of the base, mid ventricle and apex, divided into 16 segments according to American Heart Association segmentation model. The arrows show peak counter-clockwise (a) and peak clockwise (b) velocities. ED end diastole, ES end systole, LV left ventricle, 1 isovolumetric contraction, 2 rapid ejection, 3 reduced ejection, 4 isovolumetric relaxation, 5 rapid filling, 6 diastasis, 7 atrial systole

