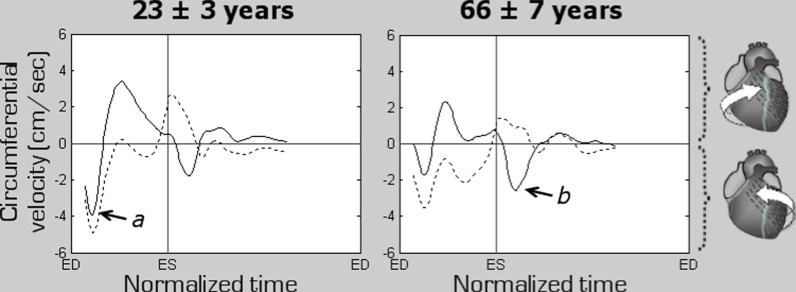
Fig. 4.
Changes in the rotational motion pattern of the left ventricular (LV) apex and base in the two age groups. Positive values correspond to clockwise rotation as viewed from the apex, while negative values reflect counter-clockwise motion. The graphs represent average myocardial velocities for the two groups of volunteers. Solid line shows rotational motion of the LV base, while dotted line shows rotational motion of the LV apex. The arrows point towards the peak counter-clockwise velocity of the ventricular base, which in younger subjects was represented by the initial wave of counter-clockwise rotation of the entire ventricle at the commencement of systole (a, solid graph), whilst in the older age group, it was represented by a recoil wave of ventricular untwisting in diastole (b, solid graph). ED end diastole, ES end systole

