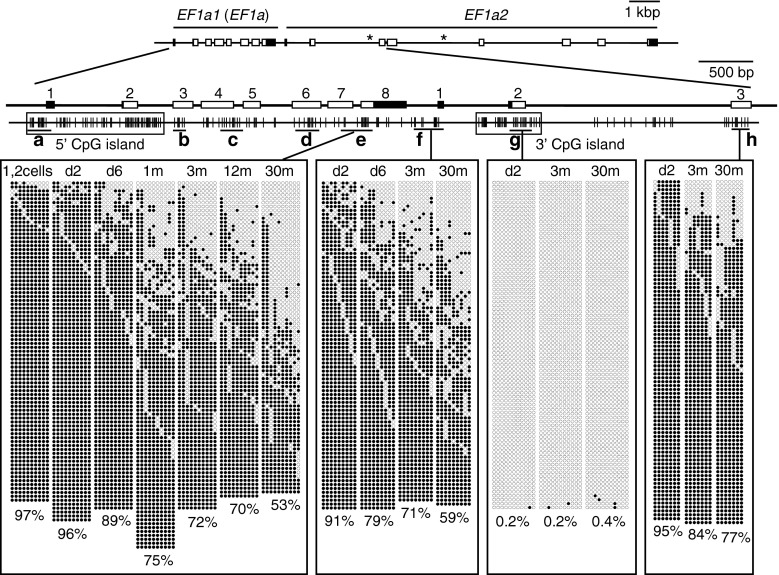
Fig. 2.
Age-dependent hypomethylation at a CpG island shore region in the EF1α locus. The methylation levels of various regions in the zebrafish EF1α locus in fertilized eggs (1, 2 cells), embryos (d2), young larvae (d6), and muscle of immature (1-month-old) and adult fish (3-, 12-, and 30-month-old) were analyzed by bisulfite sequencing. Schematics of EF1α1 (EF1α) and EF1α2 are shown at the top. Asterisks represent positions where unread sequences in the Sanger database were determined in this study. Filled and open rectangles indicate untranslated and translated regions, respectively, and numbers on exons are also shown. Vertical lines indicate the positions of CpG dinucleotides. Black horizontal bars with small letters indicate the regions analyzed. Filled and open circles show methylated and unmethylated cytosines, respectively. Crosses indicate the positions where CpG was absent due to DNA polymorphism. A total of four single embryos, four larvae, and four adult fish were analyzed to obtain methylation profiles for each region, and at least 20 clones were sequenced per fish for each region. In addition to a conventional CpG island that covered exons 1 and 2 of the EF1α1 gene (5′ CpG island, Fig. S2A), there was another CpG island downstream of the gene (3′ CpG island). Age-related hypomethylation was observed at a limited region juxtaposed to the 3′ CpG island, a region called the “CpG island shore.” The percentages of mean methylation levels were shown at the bottom

