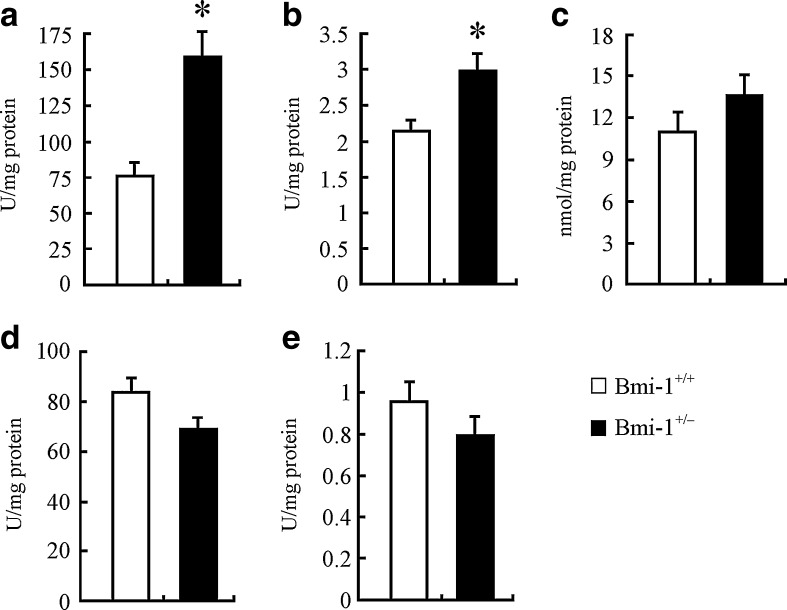
Fig. 3.
Levels of oxidative/antioxidative parameters in Bmi-1+/− brain. a Bmi-1+/− brain demonstrated significantly higher hydroxy radical levels, compared to Bmi-1+/+ brain. b Reduced GSH levels were also significantly increased in Bmi-1+/− brain. c–f MDA was slightly increased (c), while T-SOD (e) and T-AOC (f) were mildly reduced in Bmi-1+/− brain. Data represent mean ± SEM from five mice per group performed in triplicate. *P < 0.05 vs. Bmi-1+/+ mice

