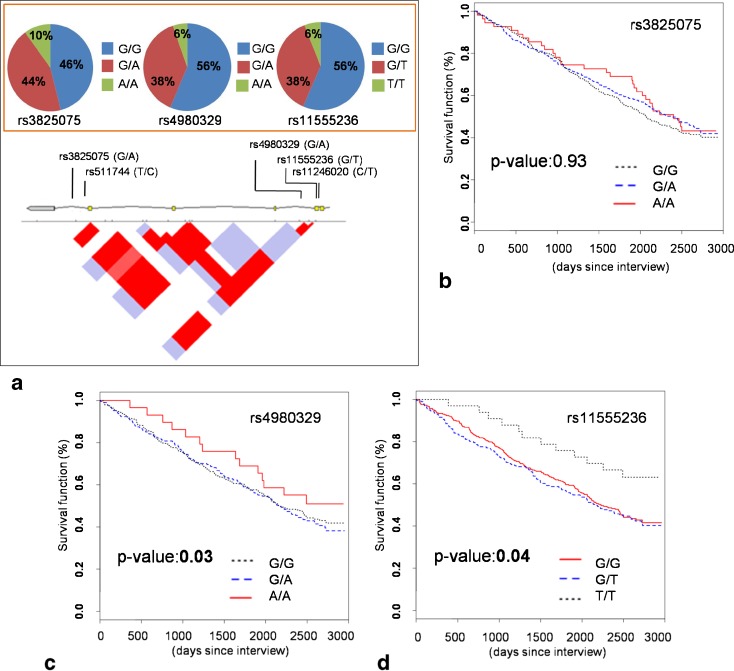
Fig. 1.
Genotyping and survival curves of the TRELONG population. a Graphical representation of the SIRT3 gene portion encompassing the single nucleotide polymorphisms genotyped in the TRELONG population. The genotypic frequency is graphically indicated for rs3825075, rs4980329, and rs11555236, while just the position is shown for the tagged SNPs rs511744 and rs11246020. Below the gene structure, where exons are in yellow, a linkage disequilibrium graphical representation is reported; red diamonds are suggestive of high LD (D' >80 %). b Survival plot of the whole TRELONG population stratified according to rs3825075 genotype. The reported p value is corrected for possible confounding factors affecting longevity (age, gender, scholarity, cholesterol level, cardiovascular disease, vascular cerebropathies, diabetes, and cancer). c Survival plot of the whole TRELONG population stratified according to rs4980329 genotype. The p value was corrected as above. d Survival plot of the whole TRELONG population stratified according to rs11555236 genotype. This SNP was reported to be in linkage disequilibrium to a putative enhancer variant within SIRT3 intron 5 (Bellizzi et al. 2005). The p value was corrected for the same variables as previously detailed

