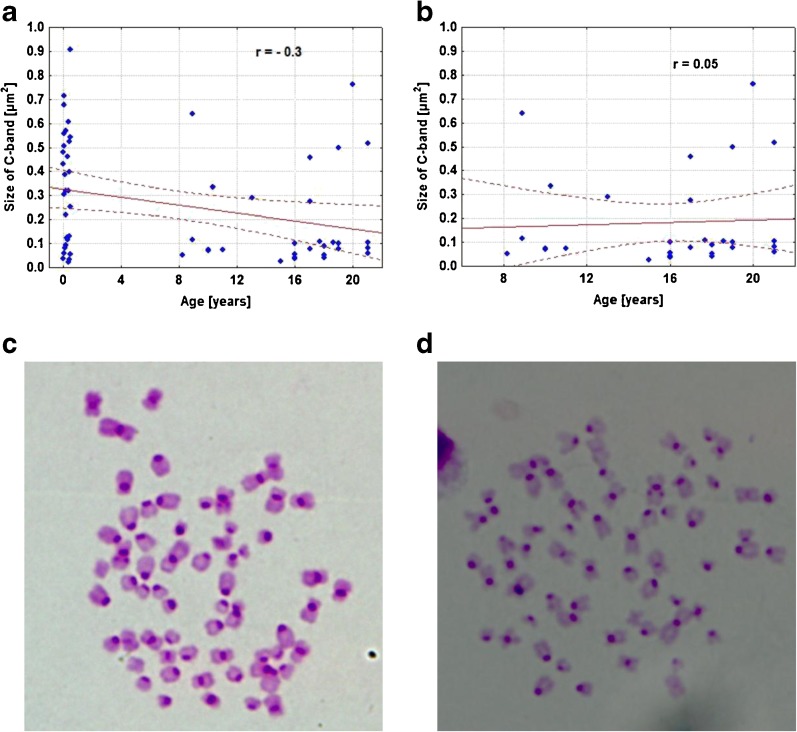
Fig. 6.
Changes in pericentromeric heterochromatin level during juvenile-to-aged period (a) and adult-to-aged period (b). Pericentromeric heterochromatin was assessed as a size of C-bands. a n = 60, r = −0.3, p = 0.02; b n = 29, r = 0.05, p = 0.8. Results represent the mean from three independent experiments. Correlation analysis of the data was performed using a linear correlation (Pearson r) test. c, d Representative micrographs of metaphase spreads obtained from young (c) and old (d) animals are shown

