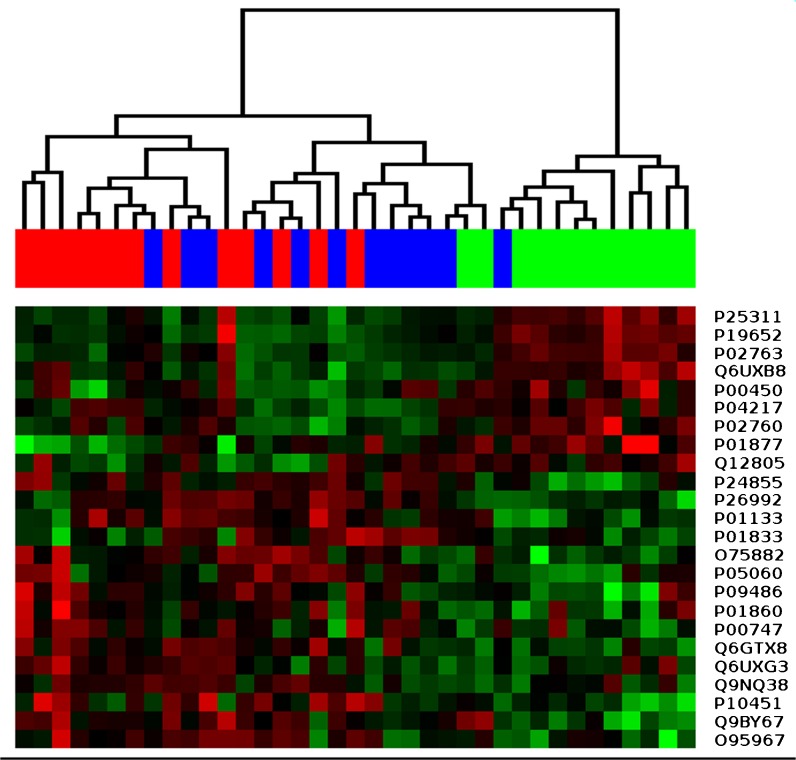
Fig. 3.
Hierarchical clustering of urine samples from groups: AVG_21 (red, 13 samples), AVG_49 (blue, 12 samples), and AVG_79 sample sets (green, 12 samples). Relative abundances of 24 proteins showing statistical significance (adjusted p value ≤ 0.05; FC ≥ 1.5) in at least one pair-wise comparison between groups (Table 2) were used to generate the cluster tree

