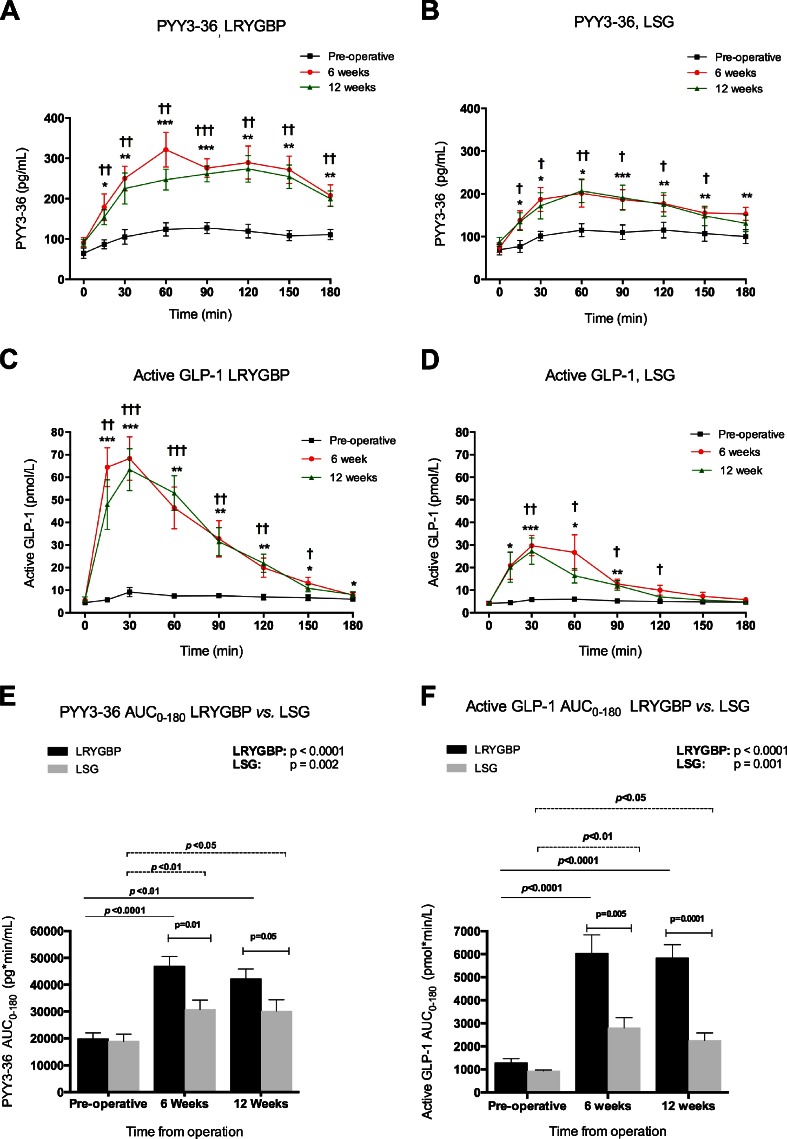
Fig. 3.
The effects of LRYGBP and LSG on fasting, meal-stimulated plasma concentrations and area-under-the curve (AUC0–180) for PYY3–36 and active GLP-1. Plasma PYY3-36 temporal profile in response to the test-meal for LRYGBP (a) and LSG (b) groups at pre-surgery (black, solid squares) and at 6w and 12w post-operatively (red, solid circles and green, solid triangles, respectively). Plasma active GLP-1 temporal profile in response to the test-meal for LRYGBP (c) and LSG (d) groups at pre-surgery (black, solid squares) and at 6w and 12w post-operatively (red, solid circles and green, solid triangles, respectively). PYY3-36AUC0-180 (e) and active GLP-1AUC0-180 (f) for LRYGBP (black, solid columns) and LSG groups (grey, solid columns) at pre-surgery and at 6w and 12w post-operatively. Results are expressed as mean ± SEM. *p < 0.05, **p < 0.01 and ***p < 0.001 within-group at 6w post-operatively compared to pre-surgery. † p < 0.05, †† p < 0.01 and ††† p < 0.001 for within-group comparisons at 12w post-operatively versus pre-surgery. The p values at the right upper corner of e and f indicate one-way ANOVA within-group analysis. Within-group Bonferroni post hoc and between-group t test significance is indicated over the corresponding bars

