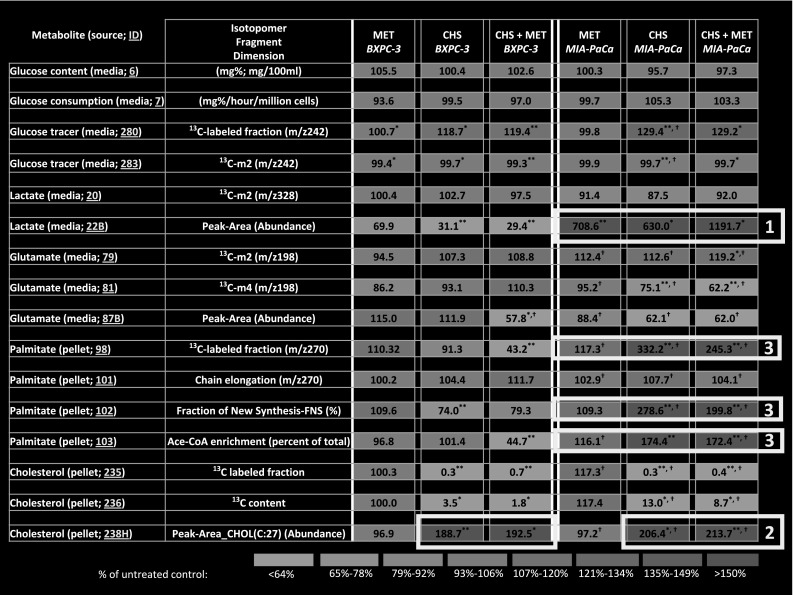
Fig. 2.

EZTopolome(K-ras); isotopolome-wide association study (IWAS) array showing heat map [percent changes to untreated control (100 %)] of flux responses associated with CHS and MET treatment in BxPC-3 and the mutant K-ras (MIA PaCa-2) PDAC cell lines. EZTopolome(K-ras) contains group averages from Table 1 as percent of control values in an identical, coherent matrix format [please note control 100 % values are omitted for EZTopolome (K-ras)]. Visual system-wide association study (SWAS) evaluations show the significant phenotypic differences as well as effects of CHS and MET for a rapid overview of Results. *P < 0.05 versus control; **P < 0.01 versus control; †P < 0.05 versus BxPC-3 (treatment matching comparison between cell lines)
