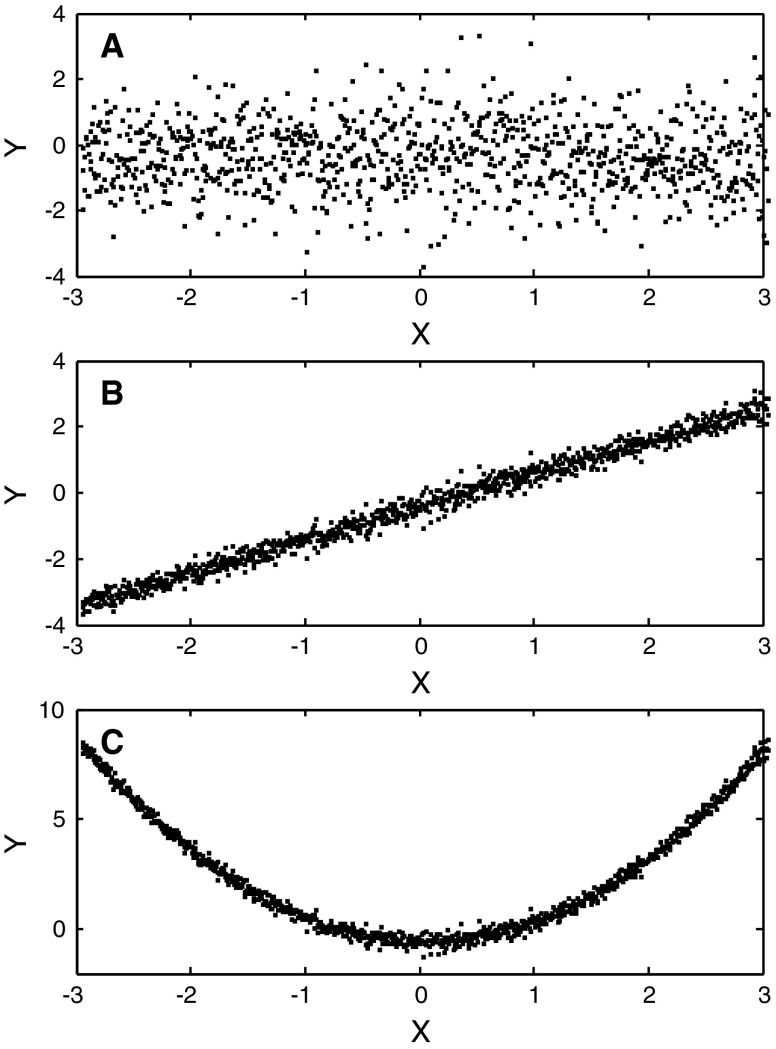
Fig. 1.
Three test signals used in the calculations reported in Table 2. In all cases x = −3 to +3 in steps of 0.0006. a Normally distributed random numbers with zero mean and unit variance. b y = x + 0.2 × ε, where ε is the first test signal. c y = x2 + 0.2 × ε. Ten thousand points were used in the calculations. Every tenth point is plotted on the diagram (modified from Cellucci et al. 2005)

