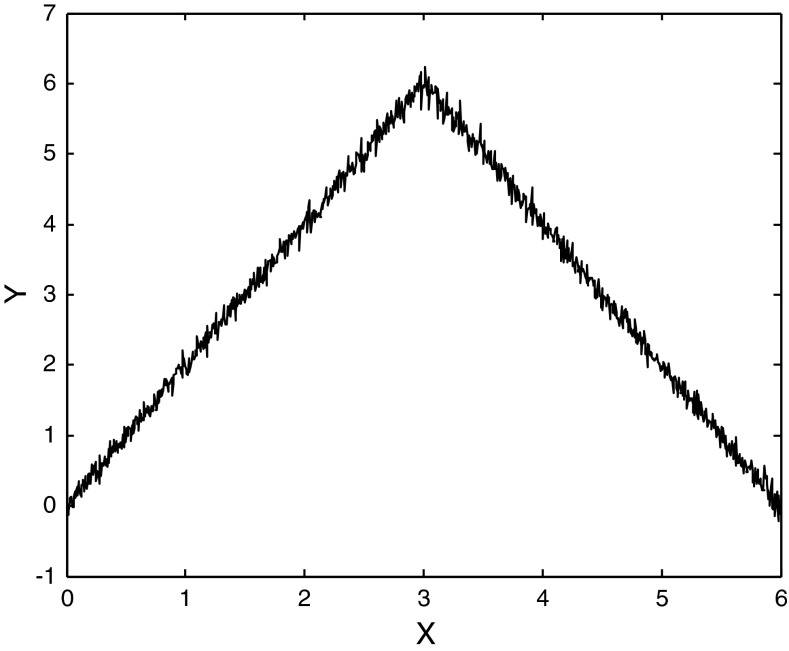
Fig. 2.
Non-monotonically correlated test signals. X = 0 to 6 in steps of 0.0006. Y = 2X + 0.1ε for X ∈ [0, 3] and Y = 12 − 2X + 0.1ε for X ∈ [3, 6]. All four measures detect a correlation for X ∈ [0, 3]. Only mutual information detects a nonrandom relationship when the paired signals are analyzed for X ∈ [0, 6]. Ten thousand points were used in the calculations. Every tenth point is plotted on the diagram

