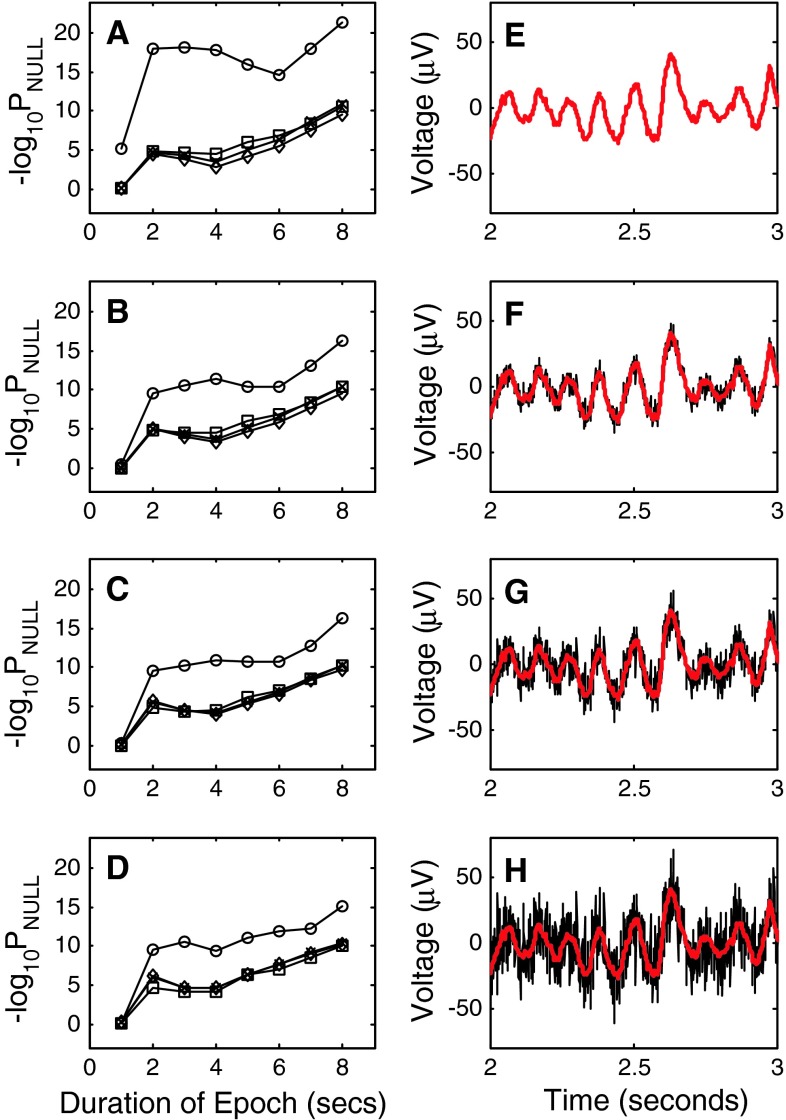
Fig. 5.
Robustness of correlation measures to additive gaussian noise. a Comparison of correlation measures using original data from 13 subjects. As before, squares identify results from the Pearson product moment correlation. Diamonds identify results from the Spearman rank order correlation. The letter x identifies results from the Kendall rank order correlation and circles identify results obtained with mutual information. b Comparison of correlation measures using data from 13 subjects following addition of gaussian noise giving signal to noise ratios of SNR = 10 dB. Symbols identifying different measures follow the pattern of a. c Comparison of correlation measures using data from 13 subjects following addition of gaussian noise giving signal to noise ratios of SNR = 5 dB. Symbols identifying different measures follow the pattern of a. d. Comparison of correlation measures using data from 13 subjects following addition of gaussian noise giving signal to noise ratios of SNR = 0 dB. Symbols identifying different measures follow the pattern of a. e Example segment of an EEG signal recorded from a single subject at electrode site Pz in the eyes closed condition. f. Component of the EEG signal shown in e after addition of gaussian noise, SNR = 10 dB (shown in black). The original signal is shown in red for comparison. g Component of the EEG signal shown in e after addition of gaussian noise, SNR = 5 dB (shown in black). The original signal is shown in red for comparison. h Component of the EEG signal shown in e after addition of gaussian noise, SNR = 0 dB (shown in black). The original signal is shown in red for comparison

