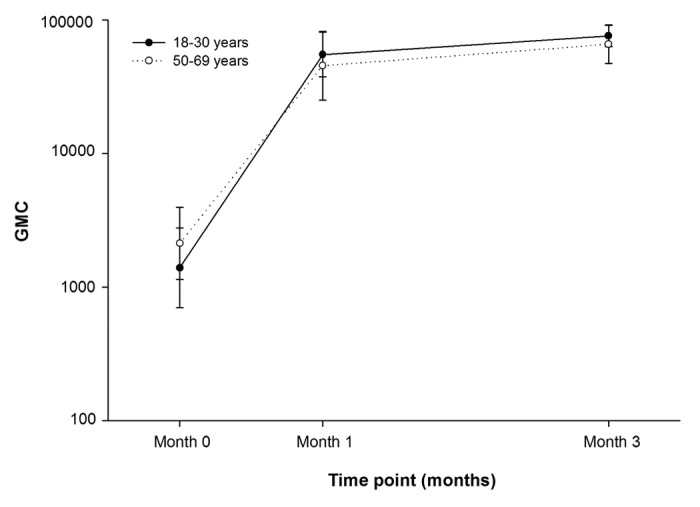
Figure 2. Geometric mean concentrations of anti-gE antibody pre-vaccination, post-dose-1 and post-dose-2 (ATP cohort for immunogenicity)

Figure 2. Geometric mean concentrations of anti-gE antibody pre-vaccination, post-dose-1 and post-dose-2 (ATP cohort for immunogenicity)