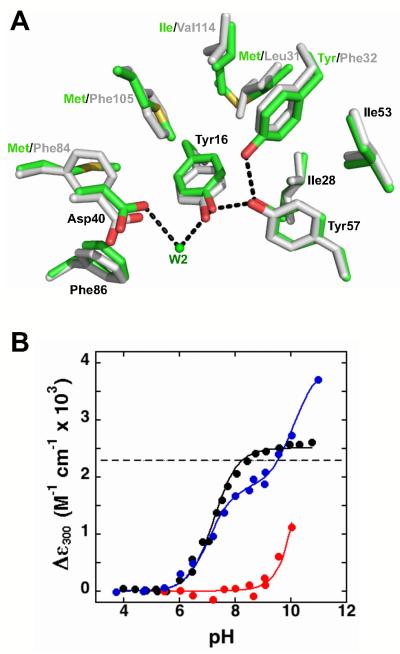
Figure 10.
Recreating the potential hydrogen bond network in tKSI. (A) Superposition of structural models of the wild-type pKSI (green, PDB ID 1OPY) and wild-type tKSI (grey, PDB ID 8CHO); while the active site residues are the same, the surrounding residues are different. (B) Relative extinction coefficients at 300 nm for pKSI D40N/D103N (black), tKSI D40N/D103N (red), and tKSI F32Y/D40N/D103N (blue) (pKSI numbering used throughout). Absorbance spectra were collected as described in the Experimental Section. The lines are fits of the data to the ionization of one or two Tyr residues, and give Tyr pKa values of 7.2 for pKSI D40N/D103N; >10 for tKSI D40N/D103N; and 7.3 for tKSI F32Y/D40N/D103N. Values are from Table 8.

