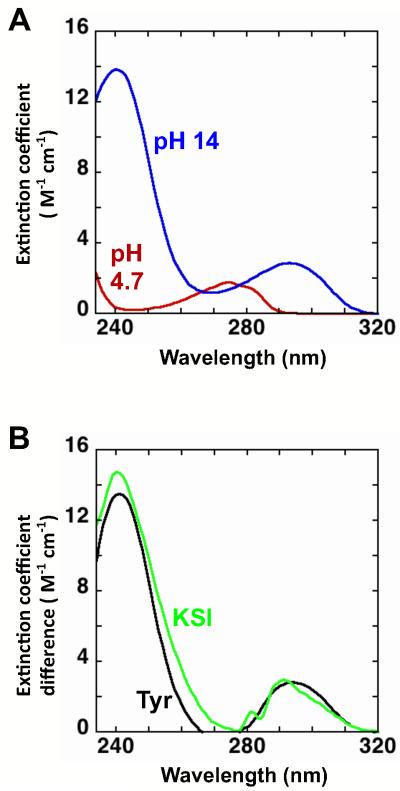
Figure 3.
Evaluating tyrosine ionization by UV spectroscopy. (A) Absorbance spectra of tyrosine measured in 10 mM sodium acetate, pH 4.7 (red) and 1 M NaOH pH 14 (blue). (B) The difference absorbance spectra for tyrosine (pH 14 - pH 4.7; black) and Asp40Asn KSI (pH 10 - pH 4; green). The difference spectra show maxima for tyrosine at 244 nm (Δε = 1.3 × 10⁴ M−1cm−1) and 295 nm (Δε = 2.8 × 10³ M−1cm−1) and for Asp40Asn KSI at 244 nm (Δε = 1.4 × 10⁴ M−1cm−1) and 293 nm (Δε = 2.6 × 10³ M−1cm−1). The similar spectra shape and extinction coefficient differences provide support for the ionization of one tyrosine. The dashed line in Figures 4 and 10 represent the expected extinction coefficient change for the ionization of one tyrosine (green).

