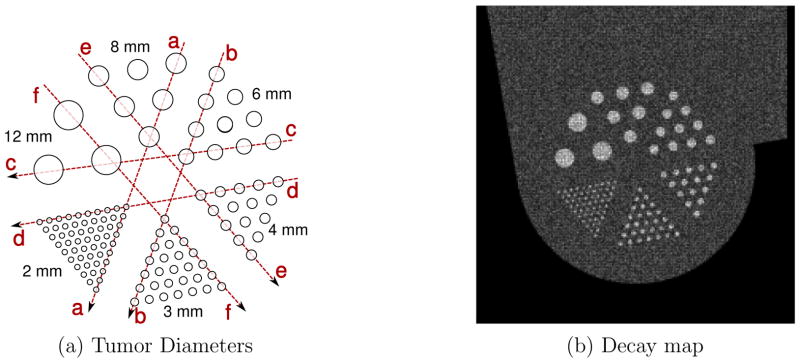
Figure 6.

(a) Illustration of the tumor plane of the phantom used in Monte Carlo simulation, showing dotted lines for line profile analysis and (b) decay map for 2.26 minute 18F-FDG acquisition, 3:1 tumor to background ratio showing radionuclide decay
