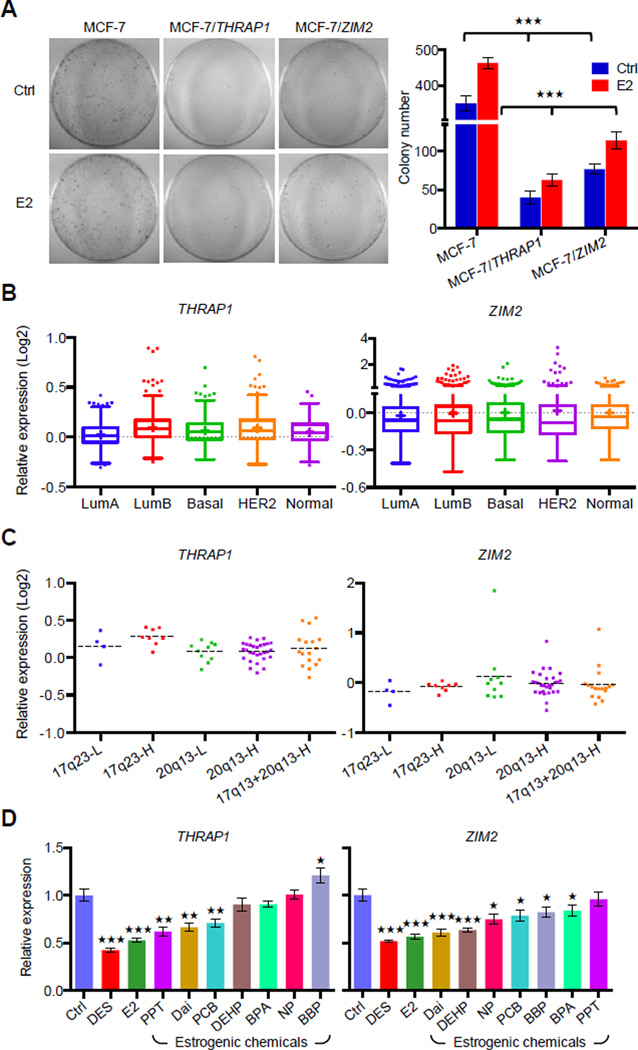
Figure 7. Amplified DEREs Repress Candidate Tumor Suppressor Expression for ERα-positive Luminal Cancer Proliferation.
(A) Determining tumor-suppressor features of two DERE-regulated loci, THRAP1 and ZIM2, in MCF-7 cells. To determine cell proliferation rate, colony formation assays were conducted in cells transiently expressing THRAP1 or ZIM2, respectively, upon E2 stimulation (70 nM) (see also Figure S6 for expression levels of THRAP1 and ZIM2 in MCF-7 transfectants). Colony numbers of two biological replicates scored by three independent researchers are shown (right).
(B–C) In silico analysis of THRAP1 and ZIM2 mRNA expression levels in breast cancer subgroups (B) and ERα-positive breast tumors within differential copies of 20q13 and 17q23 DEREs (C) using a published microarray breast cancer cohort (Curtis et al., 2012). A total of 1986 breast tumors with subgroup information were analyzed in (B); 68 ERα-positive breast tumors within amplification of either 17q23 or 20q13 DEREs were applied in the study.
(D) Expression levels of THRAP1 and ZIM2 in normal breast epithelia preexposed to estrogenic chemicals as shown in Figure 3D. THRAP1 and ZIM2 expression was determined by RT-qPCR of differentiated epithelial progeny after preexposure to estrogenic chemicals (see exposure scheme in Figure 3D, upper). Mean ± SD (n=6 replicates in two batches of treatment). ***, p<0.001; **, p<0.01; *, p<0.05 (Student’s t test), comparing to “Ctrl” cells.

