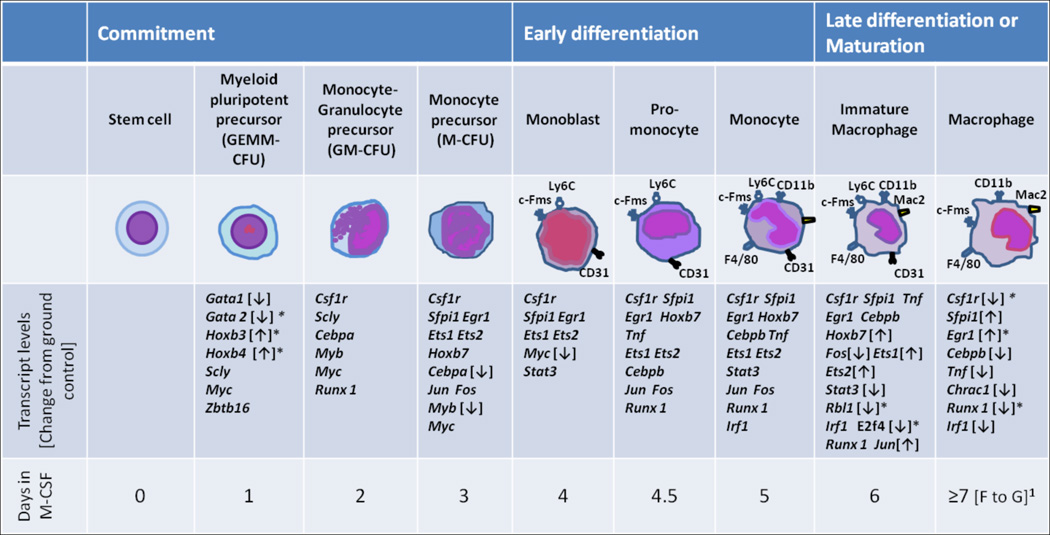
Figure 9. Transcriptional profile of bone marrow cells as they differentiate into macrophages.
Correlation of macrophage differentiation stage (top 3 rows) with known transcriptional activation during differentiation (4thand 5th row).1Arrows [↑ or ↓] indicate transcript levels of macrophages differentiated for 14 days in space during STS-126 compared to ground controls. ↑ or ↓ trends are noted only at the last known stage of transcriptional activity during differentiation [43]. * indicates significantly different from ground controls (≥1.5 fold) after Benjamini-Hochberg correction [51], P < 0.05.

