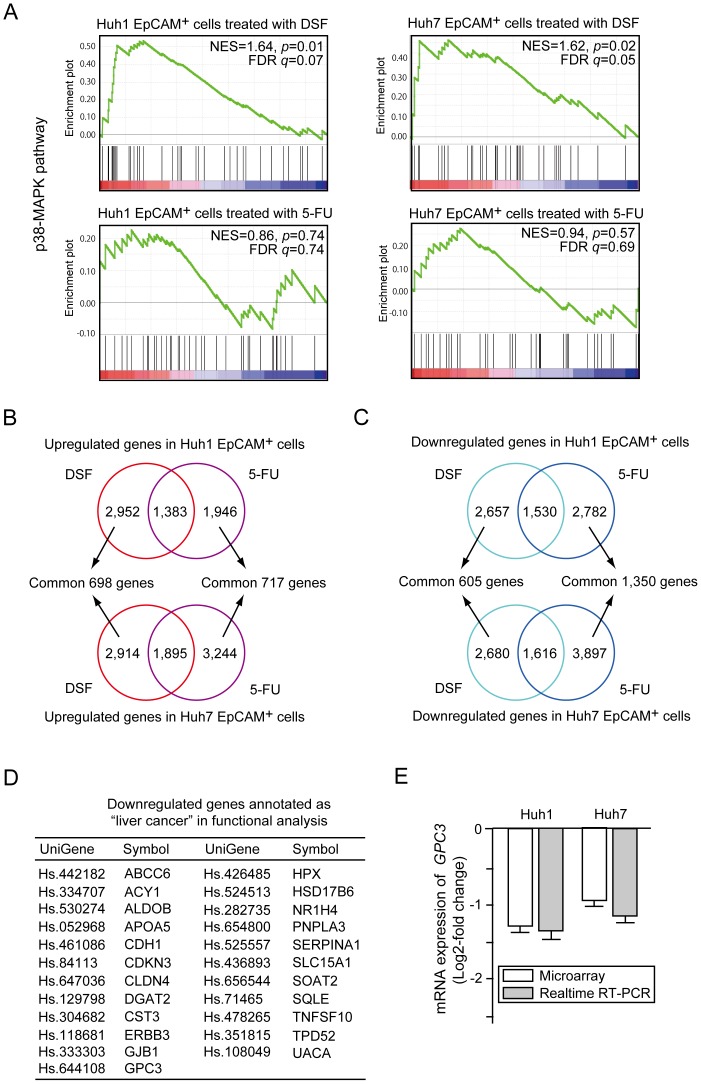
Figure 5. Gene expression profiles of EpCAM+ cells treated with DSF or 5-FU.
(A) Gene set enrichment analysis (GSEA) of the p38-MAPK signaling pathway. Both the normalized enrichment score (NES) and false discovery rate (FDR) are shown in each enrichment plot. (B) Common upregulated genes in Huh1 cells (upper panel) and Huh7 cells (lower panel) after DSF or 5-FU treatment are depicted in Venn diagrams. (C) Common downregulated genes in Huh1 cells (upper panel) and Huh7 cells (lower panel) after DSF or 5-FU exposure are depicted in Venn diagrams. (D) A list of downregulated genes annotated as “liver cancer” in DSF-treated EpCAM+ HCC cells. (E) The expression of GPC3 in DSF-treated EpCAM+ cells was compared to that in control cells. The data obtained by microarray analyses and quantitative RT-PCR analyses are presented.

