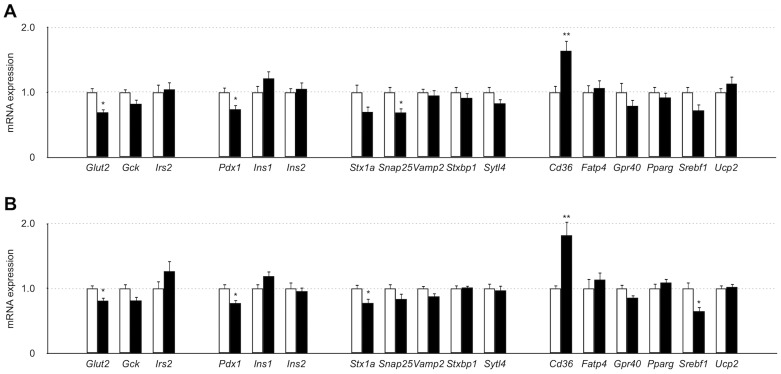
Figure 6. Gene expression levels in isolated islets of SDG-R and SDG-P mice.
Relative gene expression levels in the islets isolated before (A) and after 5-week HFD feeding (B). Gene expression levels were normalized to Gapdh, and the normalized expression levels in SDG-P mice (closed column) were expressed as relative values to those in SDG-R mice (open column). Mean ± SEM (n = 7–9). *p<0.05, versus SDG-R mice.

