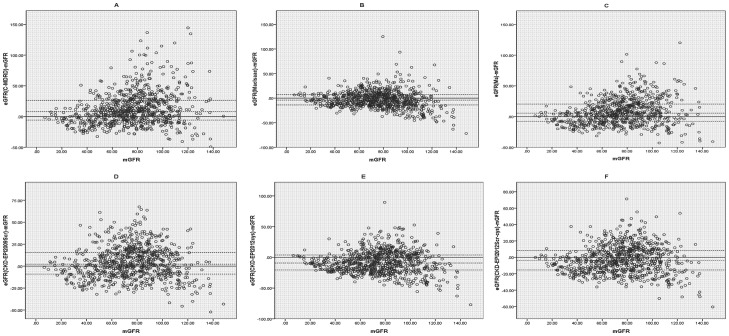
Figure 1. Bias plots intuitively compare estimated glomerular filtration rate (eGFR) with reference glomerular filtration rate (rGFR).
The difference between eGFR and rGFR was regressed against the mean of rGFR and eGFR. The eGFRs were calculated separately from six estimating equations. (A) C-MDRD: the Chinese modified Modification of Diet in Renal Disease equation; (B) MacIsaac equation; (C) Ma equation; (D) CKD-EPI2009Scr: serum creatinine–based CKD-EPI equation which was developed in 2009; (E) CKD-EPI2012cys: cystatin C–based CKD-EPI equation which was newly developed in 2012; (F) CKD-EPI2012Scr-cys: serum creatinine– and cystatin C–based CKD-EPI equation which was newly developed in 2012. GFR were measured in mL/min/1.73 m2. Horizontal solid lines represent zero bias. Horizontal dashed lines represent 25th percentiles bias, median bias and 75th percentiles of the bias.

