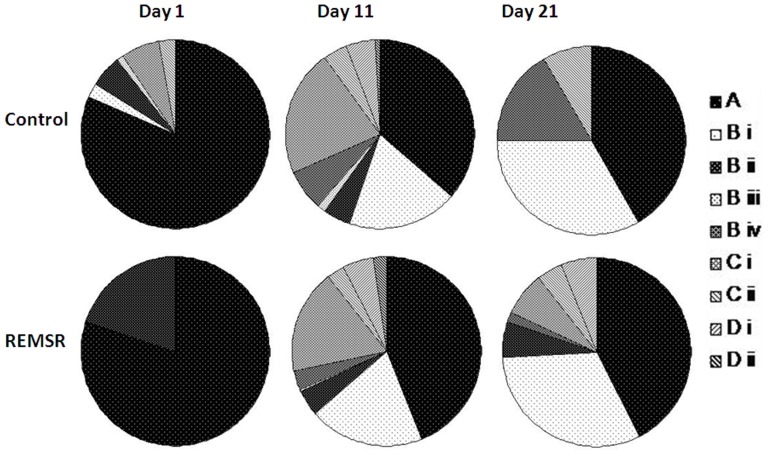
Figure 3. Distribution pattern of isolation calls during different developmental days in the control and REMSR group.
The percent distribution of various calls grouped in four categories obtained on isolation at postnatal day 1, 11 and 21 is shown in pie diagram for pups in the control and REMSR group. A denotes category consisting of flat calls; B having upwards (i), downwards (ii), U shaped (iii), and inverted-U (iv); C is sum of 2 and 3 syllable and D contains wave and complex calls.

