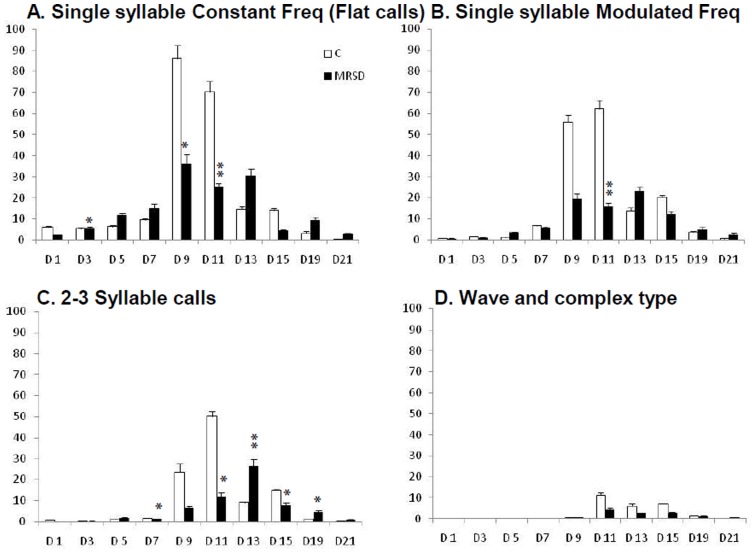
Figure 4. Distribution pattern of isolation calls grouped in four categories in the control and REMSR group.
Distribution pattern of isolation calls grouped in four categories during different developmental days in the control and REMSR group. Developmental days are shown in horizontal axis and averaged numbers of calls are shown in Y axis.

