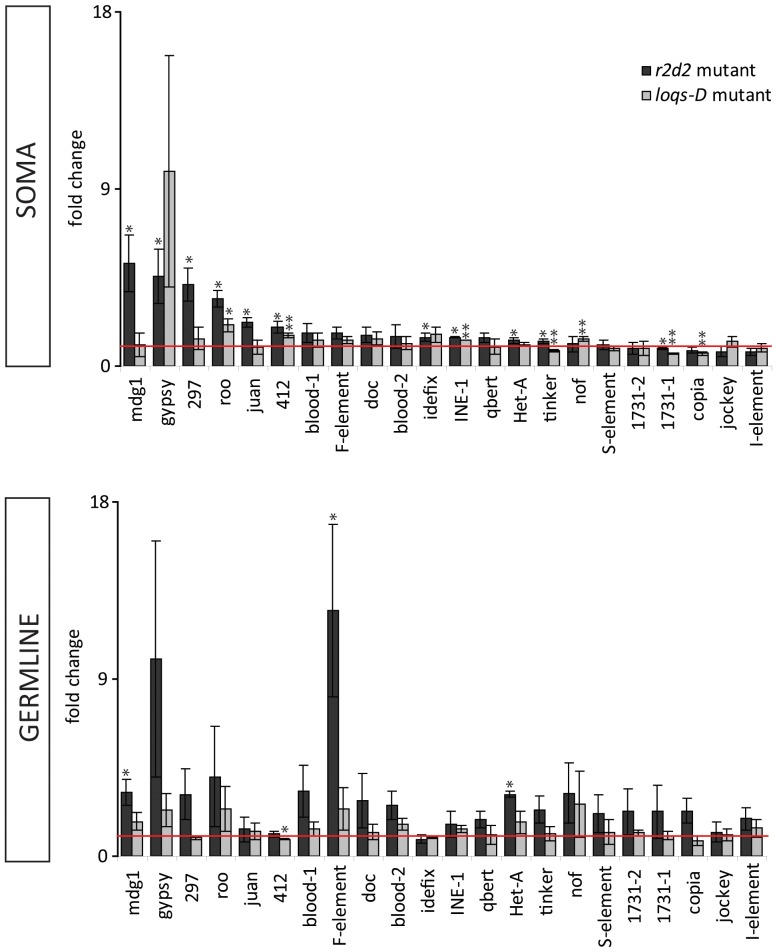
Figure 5. Analysis of steady state level of transposons by qRT-PCR.
RNA was isolated from heterozygous and homozygous r2d2 and loqs-D mutants. DNA was digested with DNase I, the RNA was reverse transcribed and used for transposon profiling by qRT-PCR. Each transposon was normalized to the average of rp49 and gapdh controls and depicted as the fold change of homozygous to heterozygous mutant in soma and germline, respectively (p<0.05(*), p<0.009(**) student’s T-test, n = 3).

